Related Articles

Faults and Sedimentary Accumulations
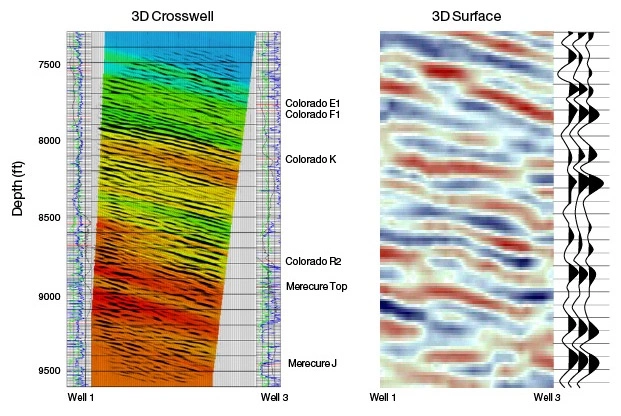
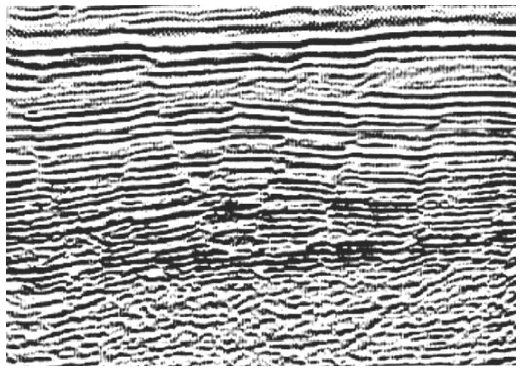
Figure 1 shows reflection character (in particular, the identifiable band of reflections in mid-section) that allows us to correlate across the indicated faults. Fault pattern recognition in interpretation is important as these structures can create leaks or traps for hydrocarbons. In this module, we will explore a number of different fault examples and examine their possible geological meaning.

The age of the faulting may be specified, in terms of the age of the upper layers, by noting at what level the fault is no longer apparent. Figure 2 and Figure 3 provide examples of two faults that form a graben. In Figure 2, the two faults appear to be of the same age; the graben developed as a single feature.
In Figure 3, the graben may have originally formed symmetrically, but, if so, the right-hand fault has certainly been rejuvenated. This example highlights the importance of correlating the complete sequence of reflections across the fault if the throw of the fault causes ambiguity between the black peaks on the two sides.

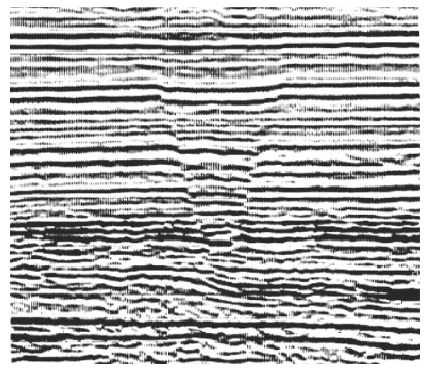
Figure 4 is an example of a complex pattern of simple faults probably nine of them. This image emphasizes that we cannot have the necessary information to understand the full picture when we have only two-dimensional sections. Faults are surfaces, not lines.
Sometimes faulting tells us something about the brittleness of the rocks. Thus, it is common to see faults totally absorbed in a thick salt layer, or in young or mobile shale. The faults in Figure 4 reduce to flexures in the topmost sediments, which were young and plastic at the time of faulting. In contrast, the extreme sharpness of the faults in the strong faulted reflection of Figure 5 seems to suggest brittleness, perhaps that of a carbonate layer.
Some faults reveal the depositional environment. Figure 6 shows a fault in which the throw increases with depth this is a growth fault. The depositional message indicated by the fault is that clastic sediments were being transported along the sea floor across the fault. The water velocity was sufficient to limit deposition on the upthrown side, but the reduction in velocity as the water deepened across the fault caused more sediments to settle. A growth fault occurs during deposition; it is a syndepositional fault. This means that correlation of reflections across a growth fault may not be easy, and that there is danger in forcing such a correlation—the layers may be genuinely different on the two sides of the fault. In Figure 6, we can see good correlations in the shallow reflections, but increasing uncertainty at depth.

When post-depositional faulting extends to the surface, erosion of the upthrown block deposits a talus of sediments on the downthrown block. Figure 7 shows three stair-step faults in ancient rocks, originally caused by rifting. We see the accumulation of erosional detritus on the first step-down (at right), and the overflow of this detritus down the steps (yellow lines indicate reflections). We would expect the sediments on the first step-down to be chaotic, and to include much coarse material. After the time represented by our pick, we can guess that a rising relative sea level caused the onlap visible above the pick; thereafter we see that the middle fault, and to a lesser degree the left-hand fault, were rejuvenated.

The plentiful supply of sediments associated with the erosion of an upthrown fault block yields several possibilities for sediment accumulation. In Figure 8, we see one of these a sediment wedge, thickest at the fault, thinning and downlapping onto the depositional floor. During this process, the additional weight of sediments may contribute to the rejuvenation of the fault, causing the depositional floor to dip into the fault.

In Figure 9 we see an initial accumulation of the same type of sediments, but this is followed by a different sediment type (yellow reflections). The sediments are building outward as well as building upward; they are prograding. Characteristically this process imparts a sigmoid shape (like a stretched-out letter “S”) to the reflections from within the accumulation. In this case, also, we suspect that the deposition was much calmer out in the down lap region, far from the sediment source, which is where we are expecting the finer-grained sediments.
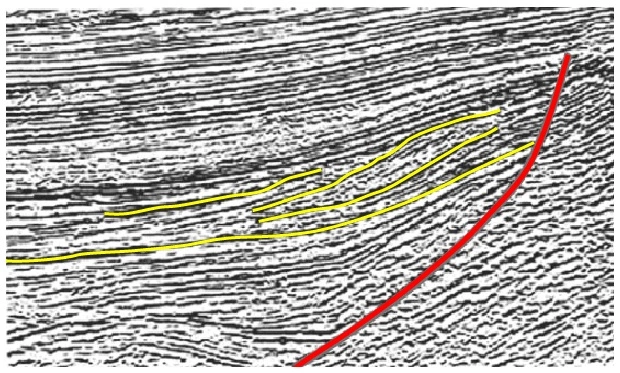
Figure 10 shows another variation of progradation. Within the reflection picks (yellow lines), we can see a sediment accumulation in which the bedding planes (though somewhat obscure) seem to rise to the upper surface of the accumulation at an oblique angle. The sediments are certainly prograding from right to left, but there is much more building outward than building upward. This suggests sediment transport across the upper surface of the accumulation (without much deposition of sediment on that surface), and then the dumping of a large mass of sediment over the edge. The most important example of this situation is a river delta wherever we see oblique progradation, we interpret the upper surface of the accumulation is a deltaic plain, rich in sandstones.

Prograding units are a frequent sight on seismic sections from marine basins. Often the whole shelf may be seen to prograde over considerable distances usually sigmoid, and occasionally oblique where the seismic line happens to cross an ancient delta. Figure 11 illustrates a sigmoid prograding shelf of unusually large proportions. This section indicates that if we are looking for find sandstones, we should be looking for local occurrences of obliquity in the shallow deposition on the shelf, or possibly in turbidite mounds in the deep deposition at the foot of the shelf slope. The rest of the sediments are likely to be rich in shales.

Figure 12 illustrates the contrast between a lower zone representing calm deposition in fairly deep water, and an upper zone representing shallower and more active water. We call the upper zone hummocky deposition.