Flowmeters (Turbine Type)
The two types of turbine flowmeters are the small-diameter and the full-bore. These tools are run continuously over the interval of interest, making a number of logging passes, usually in both the up and down directions, all at different logging speeds. These tools respond to the bulk flow rate, even in multiphase flow. They are best suited for use in vertical wells, but also may be used effectively in deviated wells, especially at higher flow rates.
The typical response to flow is shown in Figure 1.

The dashed curve is the typical turbine spinner response to a static fluid in the wellbore. The response, in terms of spinner rotational speed in revolutions per second (RPS) against logging speed, shows that the relationship is linear. The response curves, however, do not go through the origin, but instead intercept the horizontal axis on each side of the origin. This offset is due to the viscosity of the fluid; greater viscosity tends to cause a greater offset. The intercept is sometimes called the “threshold” of the spinner, although the actual tool velocity in static fluid at which the spinner begins to rotate may be larger.
When the spinner encounters an upflow, as would be expected in a producing well, the effect is to shift the response curve of the tool to the left; that is, the new response lines of the tool when it encounters the upflow are similar to the static response, except that the new response is shifted to the left by an amount equal to the upflow velocity. Figure 1 shows such response curves to an upflow, VF. If a downflow is encountered, it causes the response curve of the spinner to be shifted to the right by an amount equal to the flow velocity downhole. If the intercepts or thresholds are not symmetrically located about the margin, the same relative position is maintained to determine the flow velocity.
Interpretation of Continuous Flowmeters
The schematic in Figure 2 shows a well with two sets of perforations, each producing. The flowmeter measurements are taken in the intervals between the entries, i.e., intervals A, B, and C.

To the right of the well sketch is a minimum flowmeter logging suite consisting of three up and three down log runs, all run continuously over the intervals, and each at a different but constant logging speed. The rotational speed of the spinner flowmeter is recorded in revolutions per second (RPS). At the right is a series of plots of the spinner response curves for each of the intervals. In interval A, which should be static, the values of RPS and cable speed are plotted using values from points 1 through 6 on the log. This is the static response. A similar plot is constructed for intervals B and C, and the displacement of the B and C response curves from the static is a measure of the flow velocity upward downhole. The velocities VF and V′F are the velocities of the flow detected in intervals B and C, respectively.
If a well is producing at a high flow rate, the up runs may not be usable, because the flow velocity may be faster than the tool speed in most of the well. As a result, the spinner rotates as if the flow is up, relative to the tool. When this occurs, the technique of Figure 3 may be used.

The intercept of the response curve with the vertical axis is first located. From this point a line is drawn to the static response curve, and then down to the horizontal velocity axis. The intercept of the horizontal velocity axis is the velocity of flow in the interval being computed.
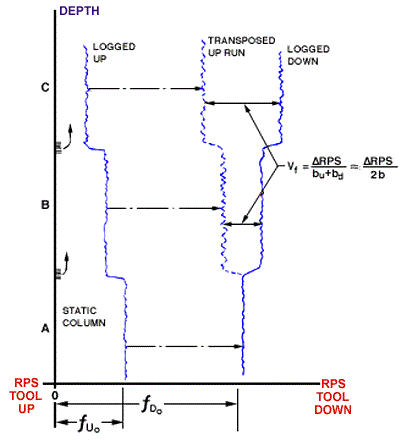
Where both up and down runs are available over the whole logged interval, the two-pass overlay technique may be used. This technique is especially useful where there are many entries over the logged interval. The first step of this technique is to plot the spinner response curve in the lowest interval. This response curve should indicate that the flow is likely zero, i.e., the intercepts fall on each side of the origin. This does not ensure zero flow, but if coupled with a fluid identification device that shows water, completion fluid, or debris in the rathole, it is certainly static. The slope of the response curves in both the up and down logging direction must also be determined. Note that these are not usually the same. Then, as shown in Figure 4, the most representative or average or composite up and down runs are overlain in the lowest interval.

The separation relative to this lowest interval, labeled ΔRPSB and ΔRPSC, may then be used to calculate the flow in each upper interval using the equations shown in the figure. Both the up and the down runs must be presented at the same RPS and depth scales for this technique to be used.
The measured flow velocities are those seen by the spinner turbine blades. If the spinner is centralized, and it should be for best results, it has sampled the flow in the center of the wellbore, which is too large. As a result, a flow profile correction factor must be used to correct the data to an accurate average velocity. For this computation, service companies may have available corrections based on Reynolds number of the flow, although a correction of 0.83 is commonly used in hand calculations. If Vi is the velocity detected by the spinner in interval i, the average velocity in interval i is
![]()
To compute the bulk flow rate in barrels per day (Q), the following equation is used:
![]()
or, in SI units,
![]()
where:
![]() = bulk flowrate in interval i, B/D (Q′i is in m3/D)
= bulk flowrate in interval i, B/D (Q′i is in m3/D)
![]() = average flow velocity in interval i, ft/min (V′i is in m/min )
= average flow velocity in interval i, ft/min (V′i is in m/min )
![]() =wellbore inside diameter open to flow, in. (ID′ is in centimeters)
=wellbore inside diameter open to flow, in. (ID′ is in centimeters)
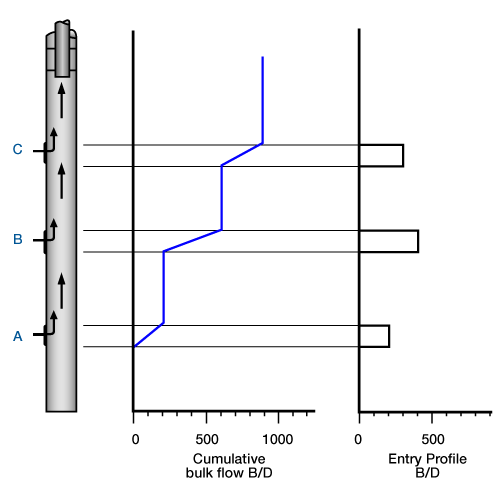
The presentation of the final computation may take the form shown in Figure 5.

In this figure, the well sketch shows three entry points and four intervals for flowmeter evaluation. The cumulative bulk flow illustrates the volume flowrates calculated by the flowmeter. The entry profile is determined from the changes in the bulk flowrate at the entry points.
 Petro Shine The Place for Oil and Gas Professionals.


