Related Articles

Unconformities
In Figure 1, the original surface of deposition was the faulted and eroded surface of an ancient rock mass. As erosion proceeded at the top left of the section, sediments were transported downdip until they came to rest. There they piled up for a time, resumed their journey, and then piled up again. The interior of the resulting pod of sediments therefore lacks clear bedding planes, which is evident in the seismic response. Probably this pod of sediments was deposited subaerially. The downdip thinning shows the characteristic downlap associated with starvation of sediments. The updip thinning is a feature of the original depositional surface, the gradient at which sediment transport occurs, and the tilting of subsidence.
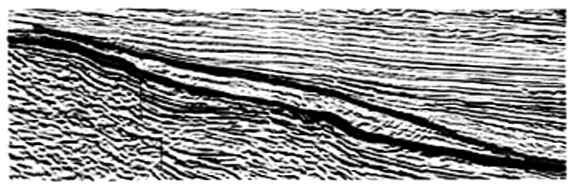
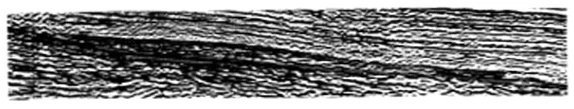
Figure 2 provides another example of deposition. The pod of sediments clearly formed at a change in the gradient of the ancient surface. To the right it lacks clear bedding planes, as before. To the left some bedding planes are visible, which suggests more orderly sediment movement and deposition, probably with a greater contribution from water.
The importance of Figures 1 and 2 in the development of our thinking as interpreters is major. These examples introduce us to the concept of sequences intervals within which sediments are genetically related, and therefore, derived and deposited by a common mechanism. This is a very important concept because the shape of the sequence in section, in the context of the rocks above and below it, tells us about the type of sediment accumulation. The internal configuration of reflections within the sequence tells us about the conditions of sediment accumulation, and often something about the sediments themselves.
Further, these examples remind us that we should not allow ourselves to be totally preoccupied with the continuity of reflections. In the days when seismic interpreters were searching solely for structural traps, they sought continuity above everything; they looked for extensive surfaces that could be mapped. If they did not find them, they blamed the processors. The processors, in reaction, devised processes to improve reflection continuity, sometimes even to force continuity. Modern interpreters, on the contrary, accept that lack of continuity and limited continuity may be important geological diagnostics. They look above, below, updip, and downdip to make judgments as to whether what they see is real, an artifact, or is noise. Then, they ask what geological processes would create such continuity, or such lack of continuity. If a pattern of reflections (continuous or not) is real, it has a geological impact.
There is an important distinction between Figures 1 and 2 in the behavior of the rocks above the sediment pod. In Figure 2 there is a layer of rock, lacking internal bedding planes, which is broadly conformable with the top of the pod. This layer is concordant with its lower boundary. In Figure 1, however, we see many reflections of contrasting dip terminating against the top of the pod. These reflections are said to onlap the pod.
Figure 3 illustrates the essence of concordance, onlap and downlap. Both onlap and downlap are subsets of the term baselap, as both are relationships between the strata in a sequence and the base of that sequence.
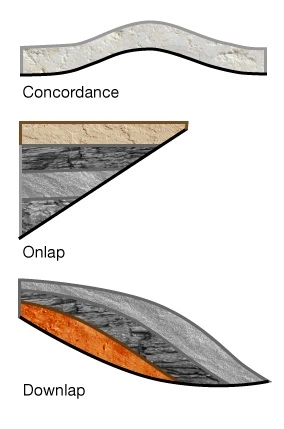
When we observe onlap and downlap on seismic sections, we know that there was, at that time, no deposition on the ancient surface updip of the onlap, or downdip of the downlap. We have then a tool to recognize a local hiatus.
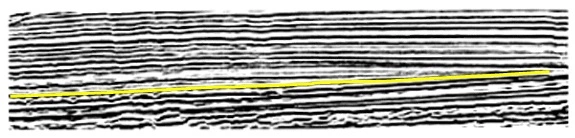
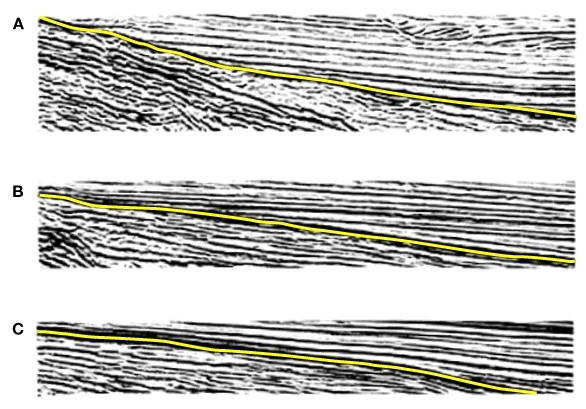
Figure 4 provides three examples of onlap. In each case, the picked reflection represents the older surface, against which younger layers are seen to onlap.
The excellent continuity of the onlapping reflections suggests that these are marine sediments, and that they onlapped progressively farther and farther to the left during a rise in relative sea level. The absence of mounds or pods of sediment (or any other evidence of a local sediment source) suggests that we are witnessing the general infilling of a basin. Where there was subsidence of the floor of the basin during deposition, we can expect the layers to thin towards onlap; this is the general situation in the illustrations of Figure 4, but in Figure 4A we can see one level at which the reflections are broadly conformable, and the subsidence was very small.
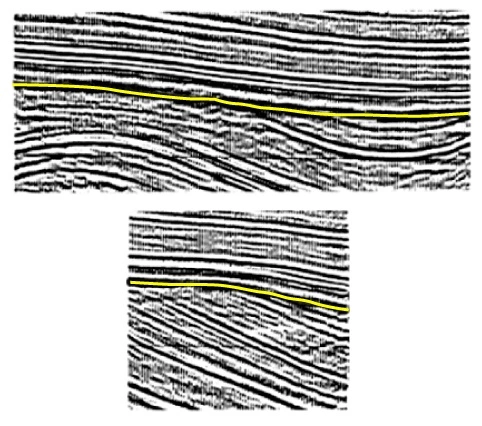
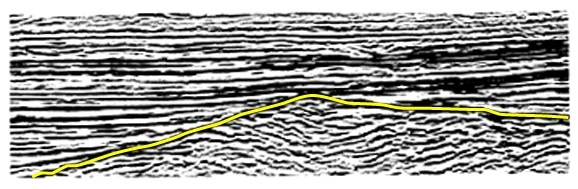
The above examples of onlap and downlap are also examples of unconformity. For a more dramatic example, in both images in Figure 5, we see the following, from older to younger events (bottom to top):
- Conformable deposition
- Major uplift and tilting
- Erosion until the eroded surface was nearly horizontal
- Conformable or near-conformable deposition
In short, we see concordance over angular truncation.
In Figure 6, an ancient complex, its surface (identified in yellow) is eroded and still rough, has become inundated by the sea. On its left flank we see marine onlap from the general infilling of the basin to the left onlap over truncation. On its right flank, however, we have downlap of an independent mass of sediments derived from a local source to the right downlap over truncation. This example illustrates that the distinction between onlap and downlap is not always easy, particularly when (as so often happens) the key to the distinction lies off the section, or when the whole area has been tilted after deposition.
The enormous importance of unconformities to the interpreter is that they are sequence boundaries. They define the limits of genetically related sediments. We saw in Figures 1, 2, 4 and 5 this is clear this is clear as all the sediments above each picked unconformity are younger than all those below it, and the sediments above and below each unconformity have no common genesis. In Figure 6 the same is clearly true for the picked unconformity. However, the sediments onlapping the left flank of the unconformity may have the same genesis as those above the crest of the unconformity both may be the result of general basin infilling at the left from a remote source of sediment. The source of sediments on the right flank is different. These sediments represent a different sequence with an independent genesis. The key to understanding these sequences, even without the information rightward of the section, is the unconformity (or unconformities) between these downlapping sediments and the ones above. Unconformities are a very important key to geological history.
On a seismic section, unconformities which involve an angular relationship between good reflections are easy to see, and it is obvious that such unconformities represent surfaces of erosion. Less easy to see are the unconformities which represent merely a period of non-deposition, for these may involve no angularity between reflections above and below.
The right portion of Figure 7 shows a clear angular unconformity. To the left, this unconformity turns into its correlative conformity. Without the angularity to the right, we would have no inkling that a break in deposition is represented by this surface. It is often important to trace unconformities into their correlative conformities, for the latter are sequence boundaries just as significant as the unconformities.