Related Articles

Sedimentary Layers
Figure 1 illustrates substantial conformity of the geological layers. Image A is a good quality marine section, and Image B is a medium quality land section. The geological meaning in both examples is that of apparent stability; the depositional surface in these examples was nearly horizontal, and it has remained nearly horizontal. Where we see a significant reflection, we infer that the type of sediment must have changed. The change of sediment could be due to a change of relative sea level, a change of sediment source, a change of climate, a change of the direction of sediment transport, or cataclysmic events far from the area of deposition, it is never due to a purely local circumstance.

Our goal in seismic stratigraphy is to determine what to accept as genuine geology, and what to dismiss as an artifact of the seismic method.
First, we need to be confident that we can rely upon the field crew and the processors to acquire and process the data to the highest standards. Then, we apply the test of geological plausibility, simply, by determining if it looks right. In Figure 1A the reflections are very continuous, and there is no doubt that they represent real geological surfaces in the earth. In Figure 1B even the best reflections are much less continuous, but there is still no doubt that they represent real geological surfaces in the earth.
Where the same irregularity is present on two or more reflections on the same trace, we dismiss the irregularity as the result of imperfect static corrections; this allows us to be completely satisfied that the upper and lower strong reflections are in fact totally continuous. The band of reflections across the center of the segment is something different. In Figure 1B, the small depression noted by the arrow is also something different. If this feature is important, the reflections are now distinctly worrying.
Our first test is to look for a related feature on other lines; this could probably explain the feature, and establish its geological plausibility. Otherwise, we must go back to the processors, and ask if there is any doubt about the variables used in the relevant processing.
But it is when we are asked about the other information on the section, the zones between the strong reflections in Figure 1B, that we are most suspicious. We need to ascertain if every seismic wiggle corresponds to something real in the earth. This is the sort of decision that we must make all the time in seismic interpretation. In the present example, we would probably dismiss most of the low-amplitude wiggles that do not have visible trace-to-trace alignment as noise. This may be a correct interpretation, and it may be incorrect.
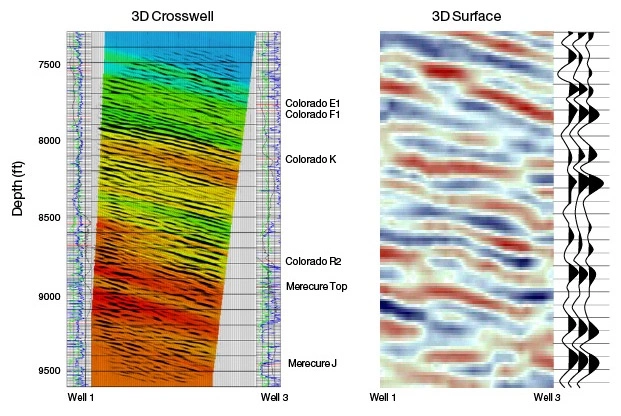
Figure 2 illustrates the difficulty of such a decision. At the top of the seismic, we have superb continuity. At the bottom, again good continuity. The seismic method is working very well in these areas. But in between the top and the bottom, we see a zone of poor continuity; corrugations, breaks, and total cessations of reflections.
We need to determine the geological message the rocks might reveal. In this example, the interpreter would look at the good continuity and relative lack of noise at the bottom, and conclude that everything in the middle zone (except one suggestion of a very steep dip that is clearly geologically implausible) is genuine; the earth is really represented well. The geological interpretation is one of differing sediments, in differing environments of deposition.

Throughout the following series of illustrations, we will be continually determining if the reflections are real, artifacts, or noise. These figures will help us prepare for most any seismic sections we encounter, such that we will be able to gain insight about the reflectors, and eventually, the geology.
Reflection Examples
Figure 3 illustrates substantial conformity after deformation, in a simple anticline. As far as sedimentation is concerned, the geological process is the same as that of Figure 1. However, after deposition and lithification, the sediments were deformed into an anticline either by compressional forces acting horizontally, by subsidence under the flanks, or (as in this example) by vertical uplift associated with deep instability.

Whenever such a thickness of rocks is uplifted in this manner, the lower layers must be compressed and the upper layers must be stretched. In an extreme case, the crest is likely to show extensional faulting, and possibly some collapse. In the Figure 3 example, the upper strong reflection shows a slight depression over the crest, indicative of the extension and incipient faulting.
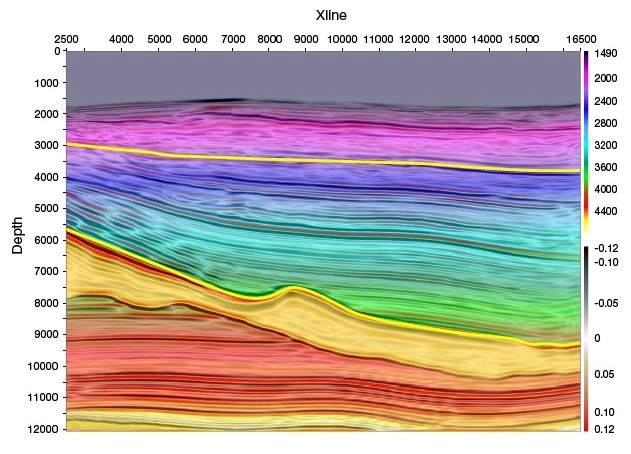
In the previous example, deposition was certainly complete before the uplift started. In Figure 4, the sediments between the two, yellow, picked reflections were being deposited during the uplift of the salt pillow, visible at the middle left. As a consequence, the interval between the two strong reflections thins to the left. The figure shows seismic with a velocity overlay; salt velocity is in yellow.
In Figure 5, we see what appears to be a thinning of sediment to the right of the section. The cause of the thinning in this example is different from the previous example. To the lower right of the diagonal across the section, we see the edge of a rift basin, formed in ancient rocks and very complicated by faulting. Sediments eroded off the ancient rocks to the top right of the section were deposited in the basin to the lower left. As the basin filled, the deep adjustment and the transfer of mass caused the basin edge to tilt to the left. Each of the reflectors visible within the top left wedge was deposited in a nearly horizontal pattern, and then tilted to the left; the older sediments, therefore, are progressively more tilted.

Although the causes of geologic events in Figures 4 and 5 are quite different, the geological impact of the thickening/thinning is the same the depositional surface was progressively tilted during deposition.
The degree of thickening into a basin is underestimated by a seismic time section. Because the velocity is likely to increase with deeper burial, the actual thickening is greater than it appears to be. By the same token, a conformable sequence which dips over a significant range of depths may appear to thin downdip on a seismic time section.
There are other reasons for thickening and thinning of reflection intervals, and we interpret according to the depositional environment which we can see on the section. For example, Figure 6 and Figure 7 illustrate the thinning associated with sediment starvation a limited supply of sediment. The sediment source is to the right. Typically, in such a case, the coarser sediments soon come to rest on the depositional surface; the finer sediments are carried farther, until they downlap onto the depositional floor.