Related Articles


Learning and Competence Level Objectives
After completing this topic “Gamma Ray Logs”, you will be able to:
- Discuss the principles of natural gamma rays and gamma ray radiation.
- Summarize the interpretation applications of LWD and wireline gamma ray logs.
- Verify gamma ray log data acquisition for quality control and standard display.
- Summarize the calibration of gamma ray detectors and well logs.
- Discuss time constants and their use in gamma ray logging.
- Interpret gamma ray logs to determine the shale volume.
- Summarize the perturbing effects on gamma ray logs.
By completing this topic and then applying the learnings in your job, you will be able to attain Basic Application Competence Level (Competence Level 2) in Gamma Ray Logging Tools and Well Logs.
Introduction to Gamma Ray Logs
Gamma ray logs measure the natural gamma ray emissions from subsurface formations. These logs record the naturally occurring radiation found in the surrounding borehole formations from three primary isotopes: Potassium-40 (K40), Thorium (Th), and Uranium (U). Because clays tend to have the highest concentration of these radioactive isotopes, a primary application for the natural gamma ray log is estimating the shale/clay content.
Gamma rays can pass through steel casing. Consequently, natural gamma ray log measurements can be made in both open and cased boreholes. In applications not discussed in this course, such as pulsed neutron logging, induced gamma rays are measured.
There are several important interpretation applications of natural gamma ray (GR) logs (Figure 1) in formation evaluation, including:
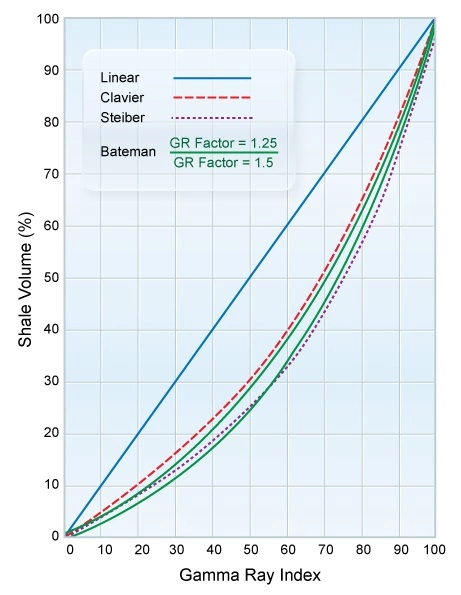
- Estimation of the shale volume (Vsh) in formations (Figure 2)
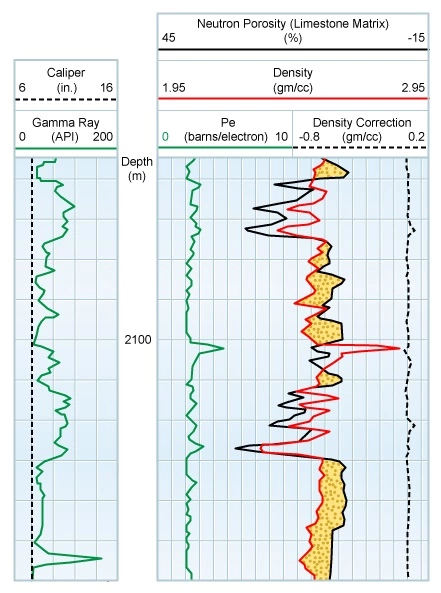
- Estimation of the net/gross ratio (net, or reservoir, interval/gross interval), usually in conjunction with the density/neutron porosity log combination. The gamma ray normally enables the identification of shaly, non-reservoir quality intervals with low effective porosities. These high shale content, low porosity intervals will be interpreted as “non-net reservoir,” and the low shale volume, higher porosity intervals as net reservoir.
- Depth control for:
- Perforating
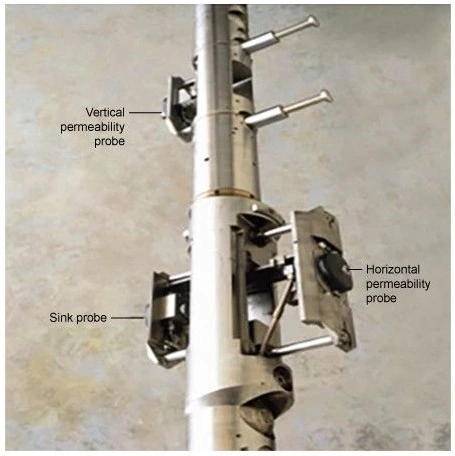
- Wireline formation tester (Figure 3) pressure points and fluid samples
- Sidewall core acquisition (Figure 4)
- Tie-ins of well logs acquired within the same wireline logging suite and between overlapping logging suites
- Tie-ins of logging while drilling (LWD) and wireline logs
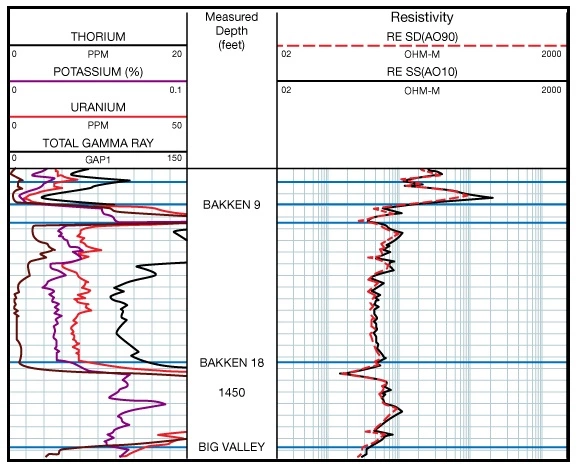
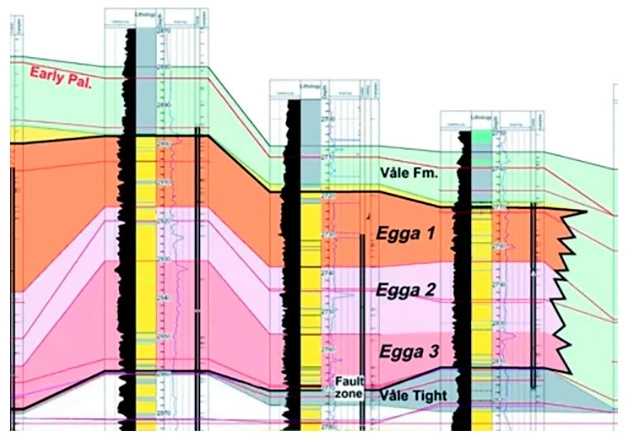
- Well-to-well stratigraphic correlations using the inflection points on gamma ray logs (Figure 5)
- Bed boundary determinations (Figure 6)
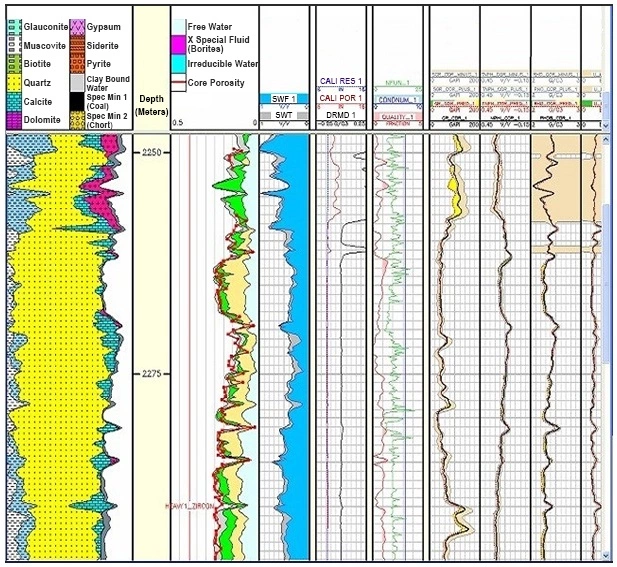
- Lithological and mineralogical analyses (Figure 7)
- Evaluation of organic shales (Figure 8)
- Tracking the movements of radioactive tracers (Figure 9)
- Geosteering using an azimuthal (directionally-focused) gamma ray tool, positioned very close to the drill bit, in logging while drilling (LWD) acquisition mode.
Applications of Natural Gamma Ray Logs


The gamma ray curve is normally presented in track 1, immediately to the left of the depth track, of the log on a linear grid and is scaled in API units. Gamma ray activity increases from left to right.
Gamma ray tools consist of a detector and the associated electronics for transmitting the gamma ray count rate to the surface. In wireline logging mode, the gamma ray tools are usually in the form of double-ended subs (Figure 11) that can be positioned within any logging tool string.

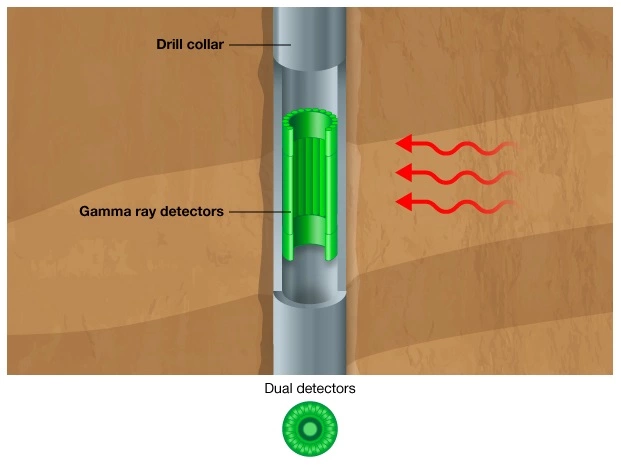
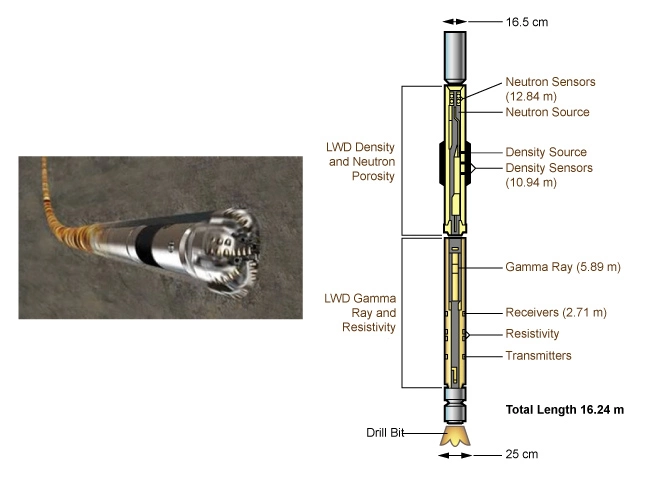
Therefore, the gamma ray log can be run with practically any available tool. In logging while drilling (LWD) mode, the gamma ray sensor (Figure 12) is normally positioned close to the bit (Figure 13) to enable early detection of bed boundaries and formation changes.
Gamma rays originate from three main natural sources: the radioactive elements in the uranium and thorium groups, and potassium. Uranium 235, uranium 238, and thorium 232 all decay, by means of a long chain of daughter products, to stable lead isotopes. An isotope of potassium K40, decays to argon.
A typical shale might contain of the order of 6 ppm uranium, 12 ppm thorium, and 2% potassium. To consistently analyze the gamma ray log readings, it is useful to consider potassium equivalents—the amount of potassium that would produce the same number of gamma rays per unit of time. Reduced to a common denominator, an average shale might contain the uranium equivalent to 4.3% potassium, the thorium equivalent to 3.5% potassium, and 2% potassium.
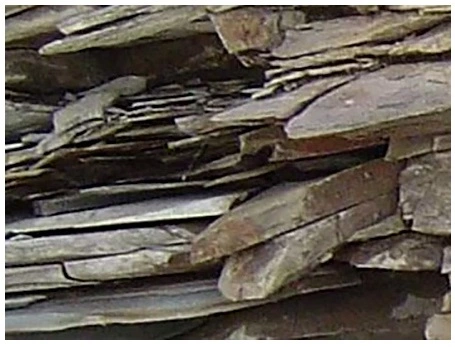
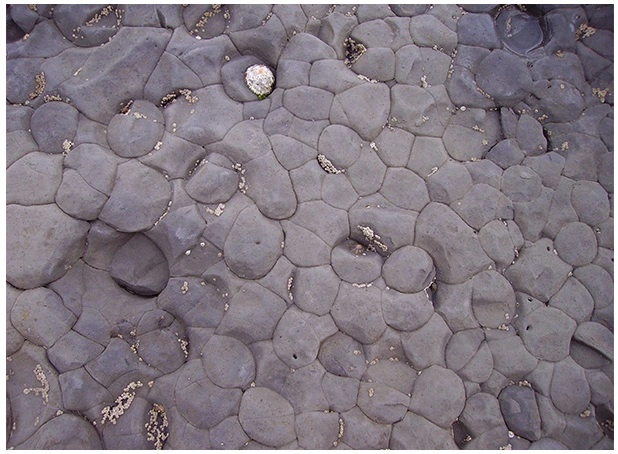
Because shale is a mixture of clay minerals (Figure 14), sand grains (Figure 15), silt and other extraneous materials, there can be no standard gamma ray activity applicable for all shales. Indeed, the primary clay minerals vary enormously in their natural radioactivity. Kaolinite and chlorite have no potassium, whereas illite contains between 4% and 8% potassium. Montmorillonite contains less than 1% potassium. Occasionally, natural radioactivity may be due to the presence of dissolved potassium, uranium, or other salts in the water contained in the pores of the shale.

Each radioactive decay produces a gamma ray that is unique. These various gamma rays have characteristic energy levels and occur in characteristic abundance, as expressed in counts per time period. Counting how many gamma rays a formation produces can be carried a step further to counting how many gamma rays from each gamma ray energy group a formation produces. If the number of occurrences is plotted against the energy group, a spectrum is produced that is characteristic of the formation logged. The relationship between gamma ray energy and frequency of occurrence, shown in Figure 16, illustrates such a spectrum, where energies from 0 to approximately 3 meV have been split into 256 specific energy “bins.” The number of gamma rays in each bin is plotted on the Y-axis.
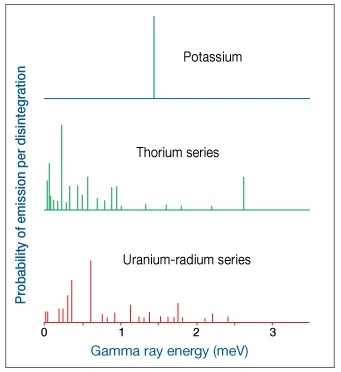
This spectrum can be thought of as a mixture of the three individual spectra belonging to uranium, thorium and potassium. A unique mixture of these three radioactive series would have the same spectrum as the observed one. The objective of gamma ray interpretation is to find a quick and easy method of discovering that unique mixture. Computers quickly find a “best fit” and produce continuous curves showing the concentrations of uranium (U), thorium (Th), and potassium (K).
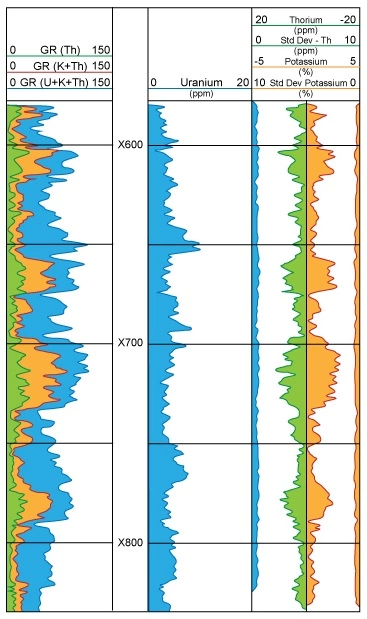
In a spectral natural gamma ray log (Figure 17), the concentrations of U, Th and K are displayed (Figure 18). Normally, the units will be displayed as percent for potassium and ppm for thorium and uranium.