Related Articles

Determining the Contemporary State of Stress
The first step in characterizing the contemporary stress regime is to establish regional constraints using publically available data. In tectonically active settings, analysis of 3D seismic data and earthquake fault plane solutions constrain the ordering of principal stress magnitudes and the orientation of principal stress axes. In tectonically inactive settings there is no reliable substitute for direct borehole measurements. Two good places to start looking for public domain stress data are the World Stress Map and the United States Geological Survey web sites.
Constraints from Tectonic Setting
The starting point for any geomechanics stress analysis is to determine the contemporary tectonic setting. Is the setting tectonically active or not? If the setting is active, the attitude of active faults will constrain the principal stress magnitudes and stress direction. If it is inactive, then the starting point would be direct measurement of in-situ stress.
Settings located close to a tectonic plate boundary are considered active. Those located in intra-plate regions, far from plate boundaries, are generally considered to be inactive. Notable exceptions are the edges of continental margins where gravity sliding and salt tectonics may be active. For example, the deepwater Gulf of Mexico is an intra-plate location where gravity driven salt movement, seismic faulting, and slope instability are active processes. Figure 1 is a world map showing the boundaries of the major tectonic plates. (http://geology.com/plate-tectonics.shtml)

Constraints from Faulting Theory
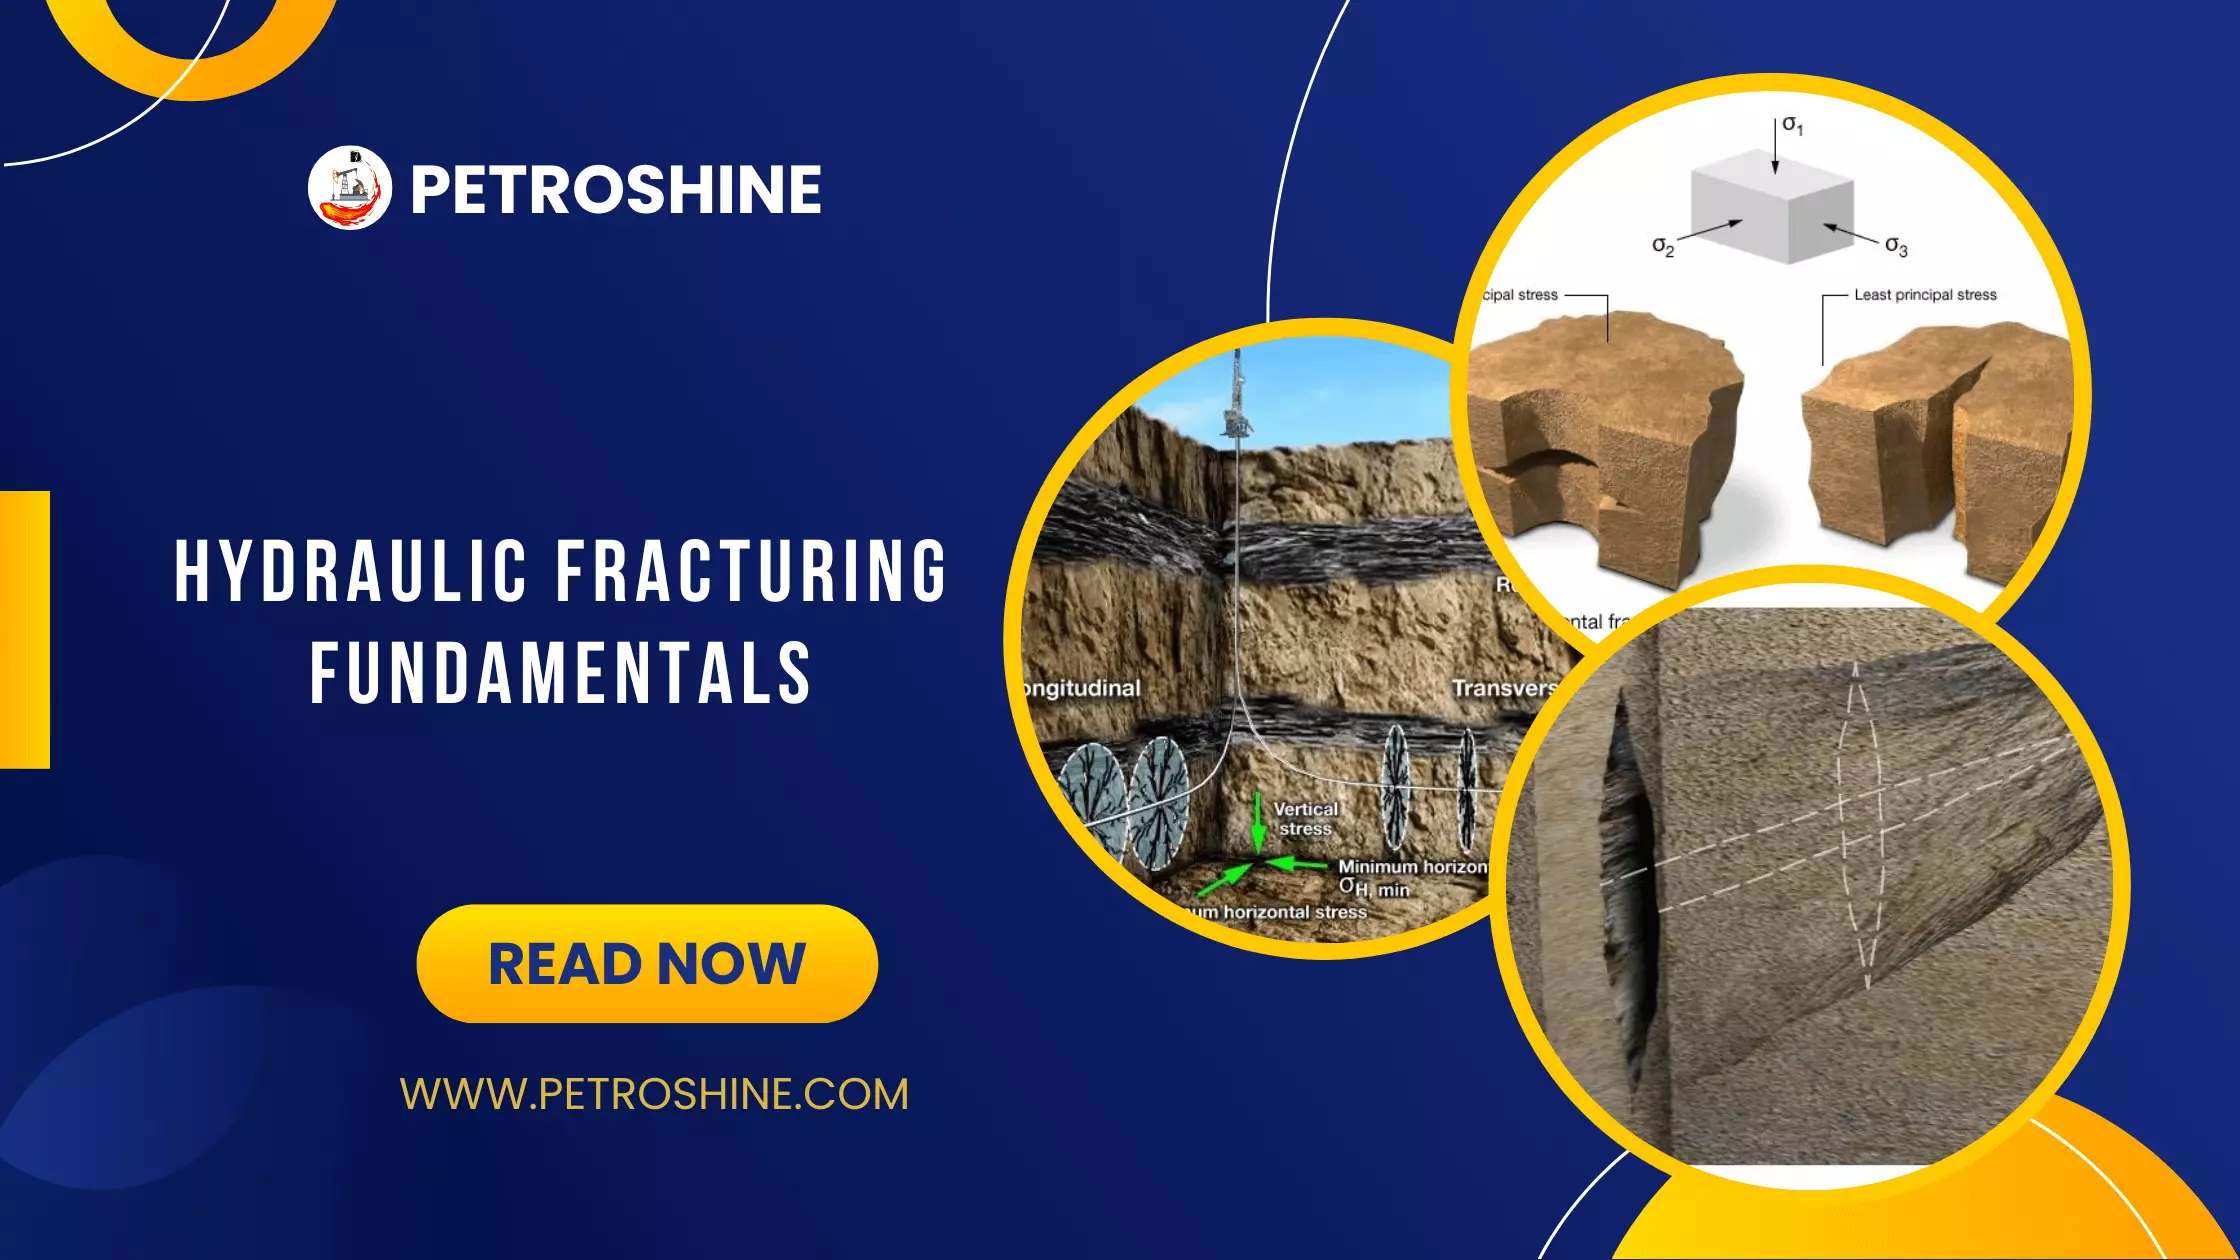
Ernest Anderson was a structural geologist working in the 1950’s, who deduced the relationship between fault initiation and the stress regime. Anderson’s theory of faulting provides the mechanical basis for determining the stress regime from active faults. He distinguished three main types of faults: normal, strike-slip, and thrust (Anderson, 1951). Figure 2 illustrates the state of stress corresponding to the initiation of the normal, strike-slip, and thrust faults. In each case, the fault plane is oriented at an acute angle with respect to the maximum principal stress, where  is the maximum principal stress and
  is the least principal stress. Depending on the type of fault, can either be
  or [/latex]S_H[/latex], and [/latex]S_3[/latex] can either be or
  . Also shown is a Mohr’s circle representation of the state of stress for each.

Table 1 shows the relative ordering of the three principal stresses for each type of fault.
Based on Anderson’s theory, the ordering of principal stress magnitudes and their orientations are constrained when it can be assumed that the stress regime has been constant since fault initiation. Greater confidence is assigned to cases where there is evidence of recent displacement across the fault.
| Table 1: Constraints on the Stress Regime from Faulting Theory | ||||
|---|---|---|---|---|
| Ordering of Principal Stresses | ||||
| Fault Type | Direction | |||
| Normal | ||||
| Strike-slip | ||||
| Thrust | ||||
Constraints from Faults Observed in 3D Seismic
Active faults can be identified from a structural analysis of 3D seismic images. A fault can be considered active if it intersects the earth’s surface and offsets recent sediments. The seismic method is most appropriate for analyzing normal and thrust faults in offshore environments where sedimentation is active and where 3D seismic data is abundant (Figure 3). 3D seismic is less useful for identifying active strike-slip faults because it is hard to find offset markers.

Constraints from Seismically-Active Faults
Another way to know if a region is tectonically active is to consult a map of recent and historical earthquakes. A good source for this information is the United States Geological Survey (U.S.G.S.) web site (http://earthquake.usgs.gov/earthquakes). In addition to providing locations of historical earthquakes, fault plane solutions are often available for recent events. Earthquake fault plane solutions indicate the style of faulting, and therefore stress direction and the relative ordering of principal stresses at the time of fault slip.
Fault plane solutions (FPS) are constructed from data recorded at seismic stations surrounding the earthquake hypocenter. The location of the earthquake is represented by the center of the diagram, and the diagrams are divided into quadrants based on whether the first motion observed on seismograms is compressional ( , not colored) or dilatational (
 , colored). Lines bounding the quadrants represent two possible fault planes plotted on a lower hemispheric stereographic projection. Figure 4 shows an FPS (known as a beach ball diagram) for each of the major fault types. The solution for a low angle thrust is shown to illustrate that the vertical stress,
  is not always a principal stress.

The relative magnitudes of the principal stresses and their directions are given by the orientations of the  ,
,  , and
, and  axes. The center of the uncolored quadrant is the axis (
 ), the center of the other quadrant is the axis (
 ), and the line defined by the intersection of the two fault planes is the
  axis (
 ). The USGS web site provides fault plane solution parameters for global earthquakes with magnitudes greater than about 5.0.
It is important to keep in mind that many earthquakes originate at significant depth in the earth. Shallow-focus earthquakes occur within 25 km of the surface whereas deep focus earthquakes can occur at depths of 100 km and more. It is best to use shallow focus events to estimate the stress regime at oil field depths.
Constraints from the World Stress Map
The World Stress Map is another useful resource for a regional stress analysis (Figure 5). Data from this site generally show a good correspondence between stress directions inferred from earthquakes and those measured in boreholes. Interactive tools, available at the site, allow you to construct a stress direction map based on fault plane solutions as well as stress direction data measured in boreholes.