Related Articles


Geosteering is the process of using real-time measurements and logging tools to steer the direction and placement of a wellbore to maximize the production of oil or gas from a reservoir. In geosteering, drilling measurements and logging tools in geosteering play a critical role in providing information about the subsurface geology and the location of the reservoir.
Drilling Measurements and Sampling
Drilling parameters and formation samples are often incorporated into the Geosteering process. Such measures include:
- Rate of Penetration (ROP),
- Torque,
- Drag,
- Weight on Bit (WOB),
- Mud temperature,
- Total gas (in balanced drilling),
- Hydrocarbon flow rate (in under-balanced drilling),
- Formation Cuttings,
- Hydrocarbon Shows, and
- Nearly anything else that a sensor could be hooked up to.
Before the advent of LWD tools, drilling parameters and mudlogger’s samples were all that were available to determine whether a well was “in zone.” Many early wells that were subsequently re-logged with gamma ray tools were found to be “out of zone.” The operator, at the time, may have been confident that the well was placed properly in-section. (Sometimes ignorance is bliss.)
With some notable exceptions, drilling parameters are the least reliable geonavigation resource when used alone. They can be often useful, however, when combined with other resources.
Rate Of Penetration (ROP)
ROP is a good indicator of formation porosity in a vertical well because the weight of the drillstring tends to rest fully on the formation being drilled, and the integrity of the formation is a primary factor in how fast the well drills. ROP becomes less dependable as an indicator of formation porosity in a horizontal well because torque, drag, and gravity all play a greater role in the drilling dynamics. This effect increases greatly with lateral length, and in fact gravity always wins, eventually making it impossible to drill any further in the lateral section.
Even so, ROP can sometimes be useful when the target rock is either much harder or much softer than the surrounding strata. Sometimes, however, problems arise when a small fault is cut, causing the well to be thrown out of target into another strata having an ROP that is similar to the target interval. ROP tells the geonavigator nothing about which bed the bit is in -it only reflects the rate at which it can be penetrated.
ROP in a vertical well is not a bad indicator because the downhole conditions are less complex. In a horizontal hole, ROP and other drilling parameters are affected greatly by both surface and subsurface events. Besides torque and drag, ROP can be affected by factors, such as WOB, RPM (Rotations Per Minute) of the drill string and the downhole motor, condition of the downhole motor, the type of drilling mud, annulus pressure, the type of bit, wear on bit, cleaning properties of the bit, etc. It is advisable to use ROP as a target indicator only, in conjunction with other geonavigation resources -but never alone.
Torque
Torque can sometimes be an indicator of fracturing and faulting in a reservoir. As the bit penetrates a fractured interval, the mud motor often hangs on breccia that is chipped from the fracture, or encounters rock with different properties across a fault. Once again, torque should be an indicator that confirms other geonavigation resources such as calcite in the cuttings or correlation across a fault with LWD logs.
Total Gas or Flow Rate
Total Gas (in balanced wells) or flow rate (in under-balanced wells) can be helpful in determining whether the well is in the reservoir’s sweet spot -but once again, it provides no true correlation to position in target. Fluid dynamics in a horizontal well is much different than in a vertical well. The drilling fluid in the annulus of a vertical well flows in a single phase with near-laminar flow. A vertical well generally has a constant hydrostatic gradient in the annulus, all the way to the bit. The fluid goes down the drill pipe, through the bit, and back up the annulus. The story in a horizontal well is quite different.
The build section, the lateral section, and gravity all combine to create very dynamic flow regimes in horizontal wells. Flow begins normally down the drillstring at the bit. However, everything changes once the fluid enters the annulus. Fluid in the annulus is generally in a multiphase, turbulent flow regime. To make maters worse, the hydrostatic pressure does not constantly increase in the lateral section of a horizontal well but may decrease or increase, depending upon depth, as shown in Figure 1: Animation showing how pressure varies with measured depth -but is more of a reflection of TVD.

This creates a situation where the well can have significant fluid transfer between the wellbore and the reservoir. Higher pressures at the bit cause fluid to transfer from the wellbore to the formation. This may turn around as the bit drills past the high-pressure zone, and the formation fluids begin to relax back into the wellbore. This effect is further driven by turbulence in the wellbore around the curve and across significant doglegs. Turbulence can cause enormous pressure differentials, causing fluid invasion in one area or swabbing in another. This means that there can be significant variance in pressure profile through the lateral section of a well.
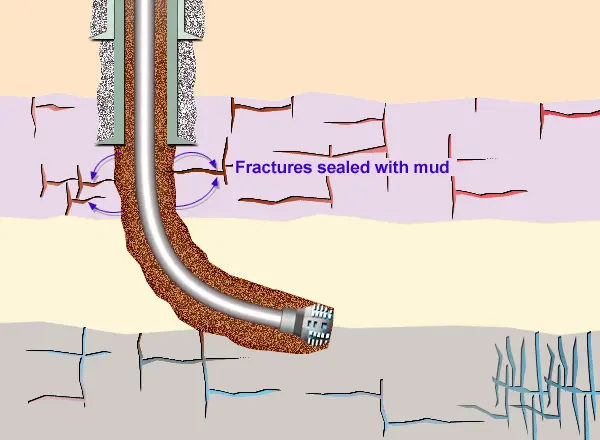
This effect can be especially pronounced in fractured reservoirs. As the bit penetrates a fracture, fluid is forced into the fracture along with cuttings. Thus, fractures can actually create a vacuum at the surface with a complete loss of returns. This sudden loss of hydrostatic pressure can cause fractures up hole (which had previously been sealed with mud cake) to swab into the well (Figure 2: Animation showing circulation of cuttings in a directional well).

There are documented cases where a well flowed 100% oil up the annulus to the surface, while at the same time, water was being pumped through the drillpipe into a fracture at the bit!
Production or shows at the surface may not come from newly penetrated formations, but from zones up-hole that had previously been sealed by mud cake. In a horizontal well, only the first show is absolutely definitive -after that, it is sometimes hard to tell whether the gas reading reflects a new zone or breakthrough production from a zone that has already been penetrated. Other indicators in the well must be used to confirm that the gas is coming from the area penetrated by the bit.
Drill Cuttings
Drill cuttings are an excellent source of information about the reservoir through which a well is drilling. When cuttings are of good quality, and when their lagged depth is calculated accurately, the samples can often be the definitive indicator of the position of a well in target -especially when there is positive mineralogy or identifiable bio-stratigraphic markers within the target and the enclosing stratigraphy. Confirmation of this position should always be made with other geonavigation sources.
The Problem with Cuttings
Problems with the evaluation of cuttings arise from at least four areas:
- Cyclic deposition;
- Changes due to drilling;
- Fractures, and
- Lost returns.
Cyclic Deposition
Cyclic depositional patterns can create problems in determining stratigraphic position from the use of drill cuttings alone.
Consider, for example, a cycle of alternating anhydrites and dolomites. A well might fault from one bed to the other without the faulting ever being recognized because the cuttings in one anhydrite may look like another, or minor changes in dolomite may be attributed to “facies changes” rather than faulting.
There is only one way to determine stratigraphic position, and that is through correlation. When trying to correlate cuttings, one must correlate the entire suite of rock properties, including:
- mineralogy,
- texture,
- color,
- grain structure, and
- fluorescence, etc.
This correlation process can be complicated if there are only small differences between beds.
Changes Due to Drilling
Minor changes in the rock properties, or destruction of certain properties caused by the drilling process may make it difficult to determine stratigraphic placement. The quality of the cuttings can be degraded through:
- PDC bits,
- mechanical grinding of cuttings by the lateral section of the drill string, and
- re-circulation or sample mixing caused by turbulent flow.
Better quality samples can be retrieved in horizontal wells that use a viscous drilling mud with good carrying properties, though even in the optimum cases, the sample quality degrades as the length of the lateral grows longer. When the lateral section gets longer, the drill string has more time (and distance) to work on the cuttings, grinding them into smaller and smaller chips. Wells that are drilled under-balanced with water often are affected more by sample degradation because the samples are not carried smoothly to the surface and may be “trapped” for a time when turbulence around the curve is encountered.
The hydrodynamic regime in a horizontal well makes calculating lag difficult in many instances. (Lag is the time required for cuttings at the bit to be circulated to the surface.) Therefore, samples do not always arrive at the surface at the expected time. As previously stated, this problem is not as great in wells that drill with a balanced system using a viscous drilling mud with good carrying properties. The viscous mud generally reduces turbulence and cleans the hole more efficiently. A well that is drilled under-balanced with clear fluids, such as fresh water or brine may experience a greater problem with lag calculation.
Fractures
Another factor which may affect lag calculation dramatically is the presence of fractures. (See Figure 3: Animation of lost circulation caused by fractures).
As explained above, horizontal wells in fractured reservoirs will exchange fluid between the wellbore and the formation in quite unpredictable ways. Quite often, returns (including the cuttings) will be lost in fractures at one depth, while other fractures are flowing (including some cuttings) back into the wellbore. This creates a mixing of samples from different zones, and means that some cuttings never make it back to the surface! In one such case, a volcanic ash bed was detected in the well on gamma ray, and not seen in drill cuttings until more than 200 feet later!
Lost Returns
The last problem with cuttings that we will describe occurs when a horizontal well is drilled with no returns. Obviously, fluid must be circulated back to the surface in order to use drill cuttings as a geonavigation source.
Even with the problems mentioned above, careful evaluation of drill cuttings can be of crucial importance when geosteering a well. However, it is important to always be aware of the potential for error, and to always check results against other geonavigation sources, especially the correlation of LWD logs.
