Related Articles


Learning Objectives
After completing this topic ” Cation Exchange Capacity and Irreducible Water Saturation “, you will be able to:
- Define cation exchange capacity (CEC).
- Summarize how the properties of clays affect the CEC.
- Describe the roles of water and geological forces in CEC values.
- Summarize how CEC values are used to interpret low resistivity log readings.
- Define irreducible water saturation.
- Describe how porosity, permeability and capillary pressure affect the irreducible water saturation.
- Discuss the implications of the level of the irreducible water saturation of hydrocarbon reservoirs.
By completing this course and then applying the learnings in your job, you will be able to attain Basic Application Competence Level in the cation exchange capacity and irreducible water saturation elements of low resistivity and low contrast pay interpretation.
Cation Exchange Capacity
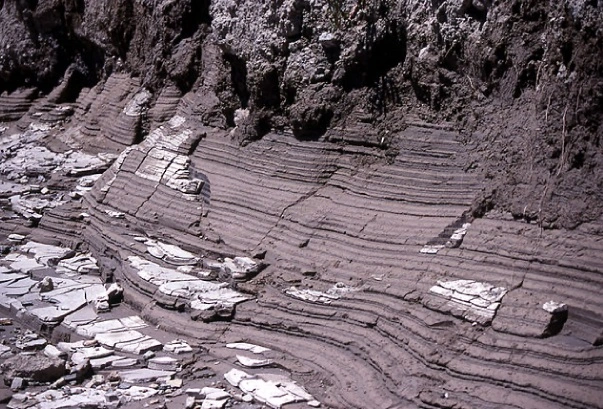
The quantity and distribution of shale and clay (Figure 1) affects the calculated, well log-derived water saturation, Sw, values and tends to reduce both the porosity and permeability within a shaly sandstone formation. Clay and shale reduce logging while drilling (LWD) and wireline log deep resistivity readings in most circumstances, often making water saturation determination difficult.
When available, the parameter “cation exchange capacity (CEC)” can be used to address the challenge of determining the water saturation of shaly sandstone formations. The CEC is the quantity of positively charged ions, termed cations, that a clay mineral can accommodate on its negatively charged surface, normally expressed in units of milliequivalent (meq) per 100 g.
Clays are aluminosilicates in which some of the aluminum and silicon ions have been replaced by elements with a different valence, or charge. For example, aluminum (Al+++) may be replaced by iron (Fe++) or magnesium (Mg++), leading to a net negative charge. This charge attracts cations when the clay is immersed in an electrolyte (such as a salty formation water) and causes an electrical double layer.
The cation exchange capacity (CEC) is often expressed in terms of its contribution per unit pore volume, Qv. It is the contribution of the cation exchange sites to the formation’s electrical properties that is important. Various techniques are used to measure the CEC of clays from a full diameter core in the laboratory, such as wet chemistry, multiple salinity, and membrane potential.
Molecular Perspective on Clays
Clay minerals consist of thin sheets made by lattices of alumina octahedra that are combined with silica tetrahedra (Figure 2).
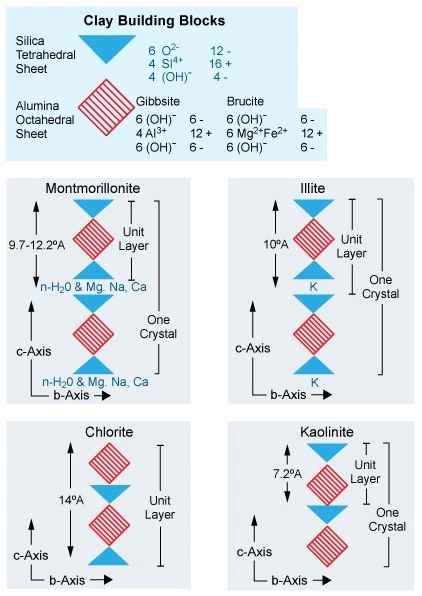
The clay sheets usually display negative electrical surface charges, which help to lower the resistivity readings acquired by the downhole LWD and wireline well logging tools. The most common cause of this excess negative surface charge is an exchange of Al+++ in the clay lattice with ions of a lower positive valence. Common exchange cations are Ca++, Mg++, H+, K+, NH4+, and Na+, each of which have a lower valence than aluminum. After such substitution, the structure of the crystal remains the same.
These cations cling to the surfaces and broken edges of the clay minerals but are easily replaced by other cations in solution when the clay particles are immersed in water. In such wet clays, the dielectric properties of the water weaken the Coulomb forces that hold the clay’s surface cations, thus releasing the cations. Electrical balance is maintained by keeping these cations in a layer at the clay-water interface, which contributes to the conductivity of the rock.
While dry clays act as insulators, wet clays are good electrical conductors. Ion exchange is responsible for the surface conductance found on wet clays when cations flow between exchange sites on the clay lattices. These cation exchange sites are caused by a charge imbalance on the external source of the clay’s molecular building blocks and provide electrical pathways through the clay.
The positive surface charge of wet clay is a function of its cation exchange capacity (CEC). The cation exchange capacity is related to the concentration of compensating cations on the clay surface (Figure 3) that can be exchanged for other cations available in a solution. The CEC quantifies the ability of a clay to release cations and can be expressed in terms of milliequivalents of exchangeable ions per gram of dry clay (1 milliequivalent equals 6⋅1020 atoms). CEC can also be expressed as milliequivalents / unit volume of pore fluid (Q), where  (Dewan, 1983).
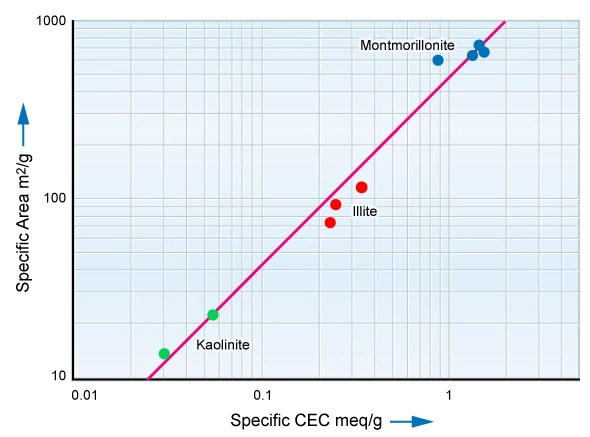
Table 1 documents the cation exchange capacity values and the components of the four most common clay types.
| Clay Type | CEC meq/g | Neutron Porosity | Average density g/cc | Minor Constituents | Potassium % | Uranium ppm | Thorium ppm |
|---|---|---|---|---|---|---|---|
| Montmorillonite | 0.8 -1.5 | 0.24 | 2.45 | Ca, Mg, Fe | 0.16 | 2-5 | 14 -24 |
| Illite | 0.1 -0.4 | 0.24 | 2.65 | K, Mg, Fe, Ti | 4.5 | 1.5 | < 2 |
| Chlorite | 0 -0.1 | 0.51 | 2.8 | Mg, Fe | — | ||
| Kaolinite | 0.03-0.06 | 0.36 | 2.65 | — | 0.42 | 1.5 -3 | 6-19 |
As clay’s conductivity is a surface conductivity effect, those clays with large specific surface areas exhibit larger CEC values. Table 2 compares the surface areas of common clay minerals to that of quartz, the usually dominant constituent of sandstones.
| Mineral | Surface Area |
|---|---|
| Quartz | 0.15  * * |
| Smectite | 752 |
| Illite | 113 |
| Chlorite | 42 |
| Kaolinite | 23 |
| * Depends on grain size and distribution |
Specific Surface Areas of Quartz with Various Clay Minerals
Note that Table 2 shows the surface area of quartz measured in terms of square centimeters, whereas that of clays is documented in terms of square meters. Clay provides a surface area which is an order of magnitude greater than that of the typical sand grain. It is this large surface area that allows clay to bind large quantities of immovable, bound water to the surface of the clay.
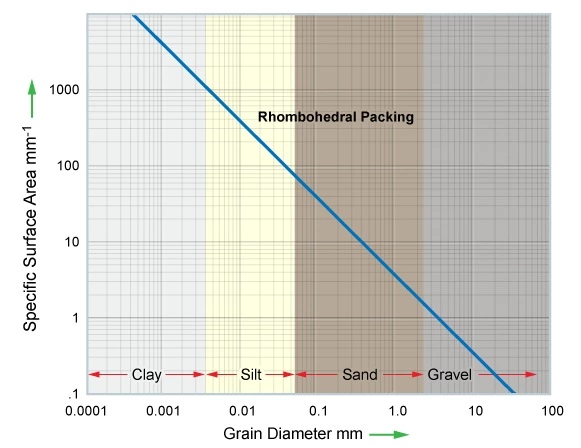
High CEC clays have a greater impact on lowering the resistivity data acquired by well logs than clays or other minerals with lower CECs. With their higher cation exchange capacity, montmorillonite and illite sometimes form major constituents of shaly sandstones and cause lower resistivity than shaly sandstones containing chlorite and kaolinite. Figure 4 displays the general relationship between grain size and grain surface area.
Measuring Cation Exchange Capacity
Logging tools do not provide a direct measurement of either the CEC or the surface area of clays and can provide no general correlation between measurements of specific area or CEC and any single clay indicator. Cation exchange capacity is measured in a laboratory, normally using full diameter core material. Techniques such as wet chemistry, multiple salinity and membrane potential are used to measure the CEC. Wet chemistry methods, such as conductometric titration, usually involve the destruction or alteration of the rock. Although quicker and simpler to perform, these methods are less representative of the electrical properties of the formation in situ. The multiple salinity and membrane potential methods are more direct measurements of the effect of CEC on the formation resistivity and spontaneous potential.
The Role of Water
The CEC is also influenced by the salinity of the formation water that interacts with the clay. Hill, Shirley, and Klein (1979) describe the solution within the pores of shaly rock as having properties that vary with the distance from the charged clay surfaces. Close to the surface, the solution contains only water and exchange capacity cations. Farther away, the solution contains equal quantities of anions and cations. The solution between these two zones is assumed to be gradational between these two end points.
The relationship between sorbed water per unit exchange capacity and the concentration of equilibrium solution is described by the following equation:

Where:
Ws= Weight of anion-free water
CEC= Cation exchange capacity
Co= Concentration of equilibrium solution
Figure 5 shows how this equation predicts that, at constant salinity, the relation between anion-free water and the cation exchange capacity should be linear, pass through the origin, and have a slope equal to 
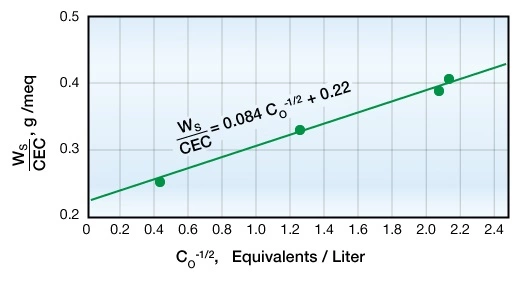
If the density of the sorbed water is assumed to be 1, the above equation can be written as:

Where:
 Effective porosity
 Total porosity
 The volume of bound water per unit total pore volume
 The cation exchange capacity per unit pore volume milliequivalents/unit volume of pore fluid
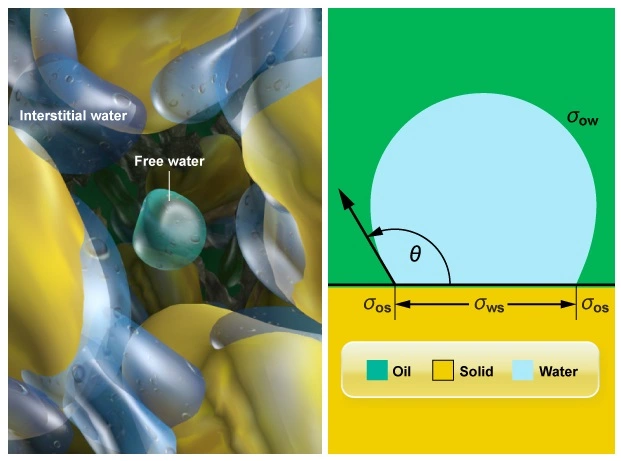
Geological Forces
Clay minerals are many times smaller than sand grains, but their high surface-to-volume ratio allows them to bind large amounts of surface water (Figure 6). Because the clay particles are electrically charged and the water molecules are polar, the surface water is held by electrostatic forces. After the clays are initially deposited, the subsequent deposition of more sediments to form an overburden will compact the clay and shale, squeezing out any loosely held water. However, the remaining electrostatically bound water will not be removed by further burial and subsequent compaction.
CEC and Water Saturation Interpretation Models
Clay minerals have significant effects on the characteristics of hydrocarbon reservoirs, such as the reduction of both the effective porosity and the permeability and, very importantly, the overestimation of the water saturation using standard resistivity interpretation techniques (due to the increased conductivity). The CEC represents the ability of clays to absorb and release cations in the presence of surrounding water with the term Qv being the cation exchange capacity per unit volume.
The parameter Qv quantifies the excess conductivity contribution of clays in reservoir rocks. It is an important parameter in resistivity-based water saturation models of shaly sandstone reservoirs, such as the Waxman-Smits-Thomas (Waxman and Smits 1968) and the dual water models (Clavier et al. 1984). Therefore, the accurate determination of Qv plays an important role in the petrophysical interpretation of oil and gas in shaly sandstone reservoirs.
The water saturation of the total porosity (Swt) is calculated at each reservoir data point by iterative solution of the complex multi-parameter Waxman-Smits-Thomas and dual water equations (Equations 1 and 2, respectively). Both the Waxman-Smits-Thomas and dual water models are total porosity/Sw system models.
The Waxman-Smits-Thomas model is based on laboratory measurements of the resistivity, porosity, and saturation of real rocks.
 (1)
(1)
Where:
Swt= the water saturation of the total porosity
B= the specific cation conductance in (1/ohm⋅m)/(meq/mL)
QV= the CEC in meq/mL of the total pore volume
Rw= the formation water resistivity
Rt= the true formation resistivity
ϕt= the total porosity
The cementation exponent, m, and saturation exponent, n, apply to the total pore volume.
The dual water model is also based on the Waxman-Smits-Thomas data. Instead of Waxman-Smits-Thomas’s BQv factor, the dual water method uses the clay-bound water conductivity and an alternative shale volume descriptor, Swb, the saturation of physically bound water in the total pore volume. When the shale volume, Vsh, is zero, then Swb is zero.
![\dfrac{1}{R_t} = \phi _{t}^{m_{o}} \, S _{wt}^{n_{o}} \left[ \dfrac{1}{R _{wf}} + \dfrac{S _{wb}}{S _{wt}} \left( \dfrac{1}{R _{wb}} - \dfrac{1}{R _{wf}} \right) \right] \qquad](https://petroshine.com/wp-content/ql-cache/quicklatex.com-f511b02f5cee9cbd9b8c4fc0d5a3fcea_l3.png "Rendered by QuickLaTeX.com") (2)
(2)
Where:
Rwb= the resistivity of clay-bound water in the shales
Rwf= the resistivity of free formation water in the shale-free water zones
Because of the different model assumptions, the dual water exponents mo and no must always be smaller than the Waxman-Smits-Thomas exponents and may have values similar to the clean sandstone exponents. Where the Waxman-Smits-Thomas and dual water models have been properly applied, the hydrocarbon pore volume results should be equal.
All Swt calculations from the Waxman-Smits-Thomas and dual water methods must be checked to ensure that they are greater than Swb. After this check, they are incorporated with the total porosity to obtain the hydrocarbon pore volume. For the dual water model, when the outputs require conversion to effective porosity, ϕe, and effective water saturation, Swe, the properties are converted with Equations 3 and 4, respectively.
 (3)
(3)
and
 (4)
(4)
