Seismic Facies Analysis
We use seismic facies analysis to interpret depositional environment and lithology within each depositional sequence in a basin. Sequence stratigraphic models provide the framework for this analysis and prediction. Seismic reflections configurations are controlled by gross stratification, and certain patterns indicate certain depositional environments and erosional processes. Using cross sections and three-dimensional models, Anstey (1992) formalizes the geological significance implied by various reflection configurations. Shell Oil Company (1987) illustrates seismic facies analysis with seismic sections from several environments.
Parallel reflection configurations within sequences indicate depositional environments in uniformly subsiding basins, where rates of deposition are also relatively uniform. Figure 1,
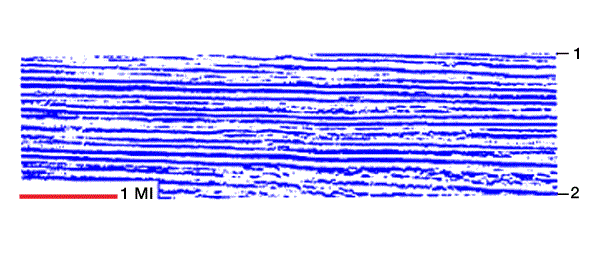
Figure 2, Figure 3,


Figure 4,
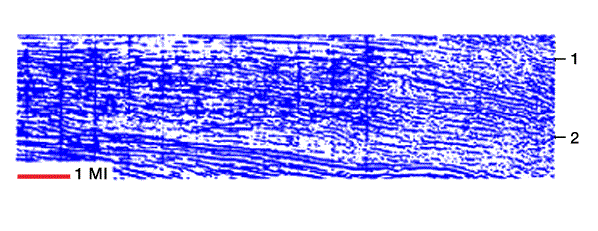
and Figure 5
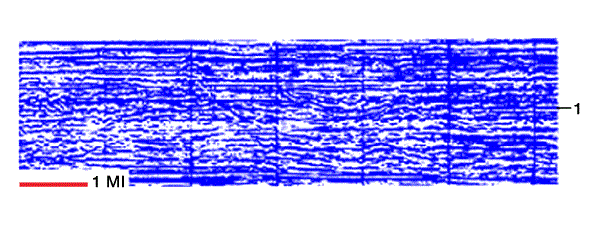
show variations in this type of configuration.
Subdivisions are based on changes in amplitude, continuity, and frequency. We can verify environmental and lithologic interpretations using well data.
Prograding clinoform reflection configurations within depositional sequences indicate lateral outbuilding of sediments. Subdivisions are related to variations in the rate of deposition and in water depth. Sigmoid patterns develop where sediment supply is low and basin subsidence/sea level rise is rapid (Figure 6).

Oblique patterns (Figure 7) develop where sediment supply is relatively high, basin subsidence is slow and sea-level is at a still-stand. These conditions result in “rapid basin infill and sedimentary bypass with some erosion of the upper depositional surface.”

External reflection configurations include mounds, fills, banks, and lenses. Mounds are typically elevated above surrounding strata, and are diverse in origin. Figure 8,

Figure 9, and Figure 10.
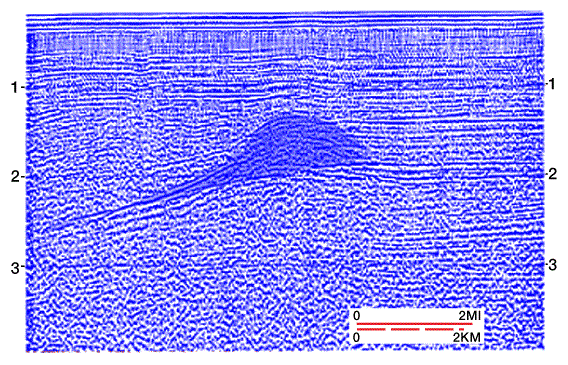
illustrate several mound configurations with various external and internal reflection configurations, which provide clues to the origin of the mounds.

Fill configurations indicate strata infilling “negative-relief features in the underlying strata.” Boundary surfaces typically show erosional truncations at the base of the fill. Internal reflections may show variations in sedimentation history within the fill strata (Figure 11 and Figure 12).


Bank configurations (Figure 13) typically mark the shelf-slope break, and basin fill onlaps the bank margin.

Lens configurations (Figure 14 ) are bounded by converging surfaces.
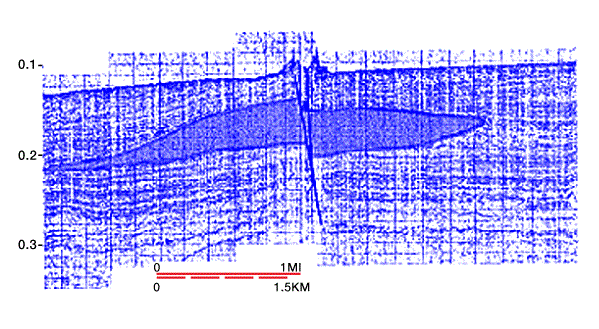
FIGURE 14
They are thick in the middle and thin towards the edges.
 Petro Shine The Place for Oil and Gas Professionals.


