Related Articles

Crosswell Seismic
Crosswell seismology provides high density, depth-calibrated seismic data between two wellbores through a data display.
Although crosswell surveys do not cover the large areal extent typical of surface seismic surveys, they are able to achieve higher resolution data than that produced by surface seismic. With resolutions of ten to one hundred times greater than surface seismic, crosswell data can help to bridge the gap between surface seismic and well log data, thus providing a detailed seismic picture of the reservoir interval between two wells.
Table 1 shows the differences between surface seismic and crosswell seismic.
| Seismic | Crosswell | 3D surface |
|---|---|---|
| Frequency | 400-1200 Hz | 40-120 Hz |
| Resolution | 1-2 meters | 5-20 meters |
| Operation | Well access | Surface access |
| Coverage | 2D section | 3D volume |
Crosswell seismic provides a detailed view of reservoir architecture to estimate reserves and plan a better field development. With crosswell it is possible to study the fine-scale fabric of the reservoir to define smaller heterogeneities and bypassed pay.
Applications for crosswell seismic are:
- An excellent complement to 3D seismic and geostatistics due to the high-resolution geological and reservoir model refinement. Crosswell data facilitates mapping of sub-seismic faults with throws of as little as one to two meters, well below the resolution of surface seismic.
- Improved reserves estimation and asset valuation
- Bypassed oil identification
- In-fill drilling planning
- Reliable horizontal well trajectory planning
- Detailed time-lapse production monitoring
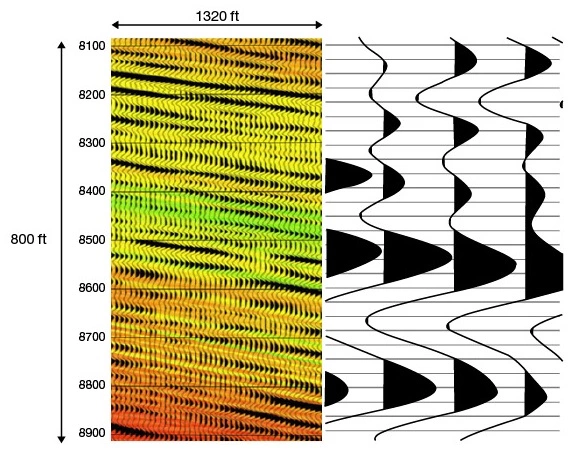
Figure 1 shows a comparison of real surface 3D depth migrated data (right) versus the reflection image with the velocity overlay from the crosswell seismic for a dip line profile from the crosswell survey. This emphasizes that we can get velocity information and reflection information with high lateral and vertical resolution only from full aperture, full wavefield data. Details such as lateral continuity of reflections in the Colorado Formation at fine detail (sands less than 20 feet thick) and discontinuous reflectors in the Merecure Formation (fluvial environment) are shown with this kind of data from the Santa Rosa gas field from Eastern Venezuela.
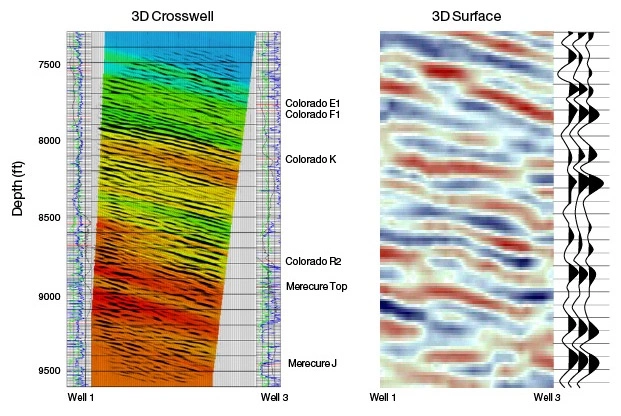
Figure 2 provides enhanced detail of a portion of Figure 1. It shows crosswell and surface seismic of a section of the Colorado K Formation. Note the increased detail and resolution of the crosswell data as compared to the conventional surface seismic.
Crosswell seismic is explored in much greater detail in the IPIMS Crosswell Seismology topic.