Related Articles


Geophysical Methods for Estimating Rock Strength
Rock strength is modeled using geophysical measurements derived from measurements of rock strength properties such as porosity, lithology, clay content, and Young’s modulus. This section presents a geophysical model of rock strength and a review of laboratory data that support its implementation in the field.
Geophysical Model of Rock Compressive Strength
The Mohr-Coulomb failure criterion provides a concise and practical description of rock strength that can be implemented using geophysical data. The model captures the two most important extrinsic and intrinsic variables that influence rock compressive strength:
- Compressive strength increases with increasing effective confining pressure.
- Rock strength varies with variations of rock composition and texture.
The geophysical model for rock compressive strength, \( \sigma_{f} \), is expressed as:
![\sigma_{f} = UCS + \sigma _{3}^{'n}\left [ \tan^{2}\left ( \frac{\phi}{2}+\frac{\pi}{4} \right ) \right ]](https://petroshine.com/wp-content/ql-cache/quicklatex.com-e39a1478aafd74006f9d76e246e0776d_l3.png "Rendered by QuickLaTeX.com")
Where
 is the peak compressive strength
 is the unconfined compressive strength
 is the effective confining pressure
 is the friction angle
 is an empirical parameter obtained by fitting a power law to experimental strength data
When  , the expression represents the straight line Coulomb failure criterion. When is less than 1, the failure envelope is concave downward as shown in Figure 1 . Initial estimates of compressive strength are obtained by setting equal to 1 and by estimating UCS and from geophysical data also are linear and power law curve fits to the data. The linear fit gives a UCS of 75.63 MPA and a friction angle of 22 degrees. Note that the power law fit honors the measured UCS of 72.5 MPa and captures the decreasing friction angle with increasing effective confining pressure.

Intrinsic and Extrinsic Properties that Influence Strength
Unconfined compressive strength and friction angle of sedimentary rocks can be estimated from intrinsic and extrinsic rock properties. Table 1 shows measureable intrinsic rock properties that are correlated with compressive strength. A plus sign indicates an increase in the variable, a minus sign indicates a decrease.
| Intrinsic Rock Property | Impact on Strength |
|---|---|
| Porosity (+) | – |
| Grain size (+) | – |
| Mineral cements (+) | + |
| Young’s Modulus (+) | + |
| Volume of clay minerals (+) | – |
| Volume of quartz (+) | + |
For example, strength is inversely proportional to porosity in sandstones, shales, and carbonates. In monomineralic grain-supported materials, strength decreases as the grain size increases (Brace, 1961). This rule does not apply to rocks where clays are the continuous load-bearing solid. In clay-supported rocks, strength is governed by the weaker clays not the stronger sand grains. An exception is observed in high-porosity sandstones ( 30%) where small amounts of clay may act as cement. In polymineralic rocks, strength increases as the volume fraction of quartz particles and quartz cement increases. Young’s modulus is correlated with compressive strength in all sedimentary rocks (Plumb et al., 1992; Deere and Miller, 1969).
Geophysical methods provide information about porosity, clay content, mineralogy, and Young’s modulus. Geologic information about depositional environment adds grain size to the list.
Table 2 shows how extrinsic properties influence rock strength. Strength increases with increasing loading rate and effective confining pressure. Increasing pore pressure reduces the effective confining pressure, hence the decrease in strength. Increasing temperature tends to weaken rocks. Of these four factors, confining pressure is most important in most oilfield situations.
| Extrinsic Rock Property | Impact on Strength |
|---|---|
| Confining pressure (+) | + |
| Pore pressure (+) | – |
| Loading rate (+) | + |
| Temperature (+) | – |
Geophysical methods provide access to pore pressure, total confining pressure and formation temperature. Loading rate is a boundary condition for engineering applications. Short-term tectonic loading rates may be estimated from studies of GPS data.
The interplay between intrinsic and extrinsic variables ultimately governs in-situ strength of rock. That interplay is captured in the Mohr-stability diagram, where the Mohr circles characterize the extrinsic effective stress and the failure envelope characterizes the contribution from intrinsic rock properties.
The remainder of this discussion focuses on geophysical measurements that can be used to estimate rock failure envelopes.
Unconfined Compressive Strength
Dependence on Porosity
Laboratory measurements show that unconfined compressive strength (UCS) is inversely proportional to porosity. Figure 2 shows UCS plotted as a function of porosity for clastic sedimentary rocks. Grain-supported (GS) and clay-supported (CS) microstructures are distinguished in this plot. Grain-supported rocks are those where quartz minerals form the continuous load-bearing solid whereas in clay-supported rocks, clay minerals carry the external loads.
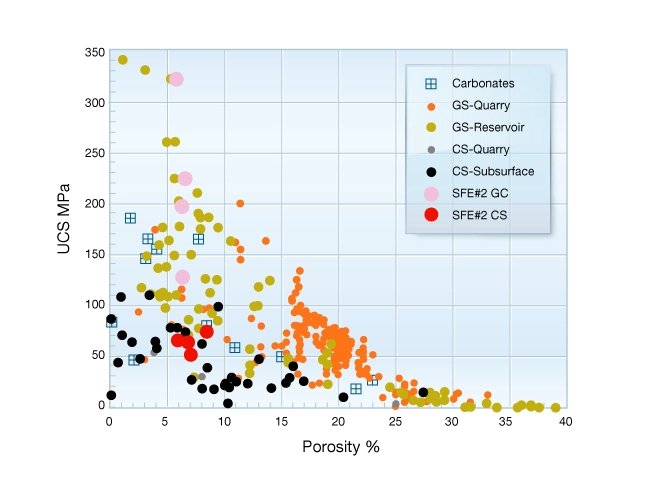
The upper bound on UCS for sedimentary rocks is defined by data from clay-free quartz sandstone. Note that for a given porosity, grain-supported rocks are systematically stronger than clay-supported rocks. Although there is considerable scatter, UCS decreases with increasing porosity for both GS and CS rock types (Hoshinao et al., 1972; Plumb, 1994). Also notice the strong dependence of UCS on porosity in GS rocks disappears when porosity exceeds 25%. The scattering of UCS at any given porosity is due to variation of cementation not captured by a measure of porosity.
Consider UCS measured on cores from the SFE#2 well (large diameter symbols). UCS varies dramatically at constant porosity. Also notice that UCS varies more in GS than CS rocks. This is attributed to variations of cementation in the grain-supported material.
Given only information about porosity and lithology for rocks with a similar burial history, first order differences of UCS are found by classifying them according to microstructure grain-supported or clay-supported. Second order effects are due to porosity variations within the GS or CS materials. Notice for GS materials, the dependence of UCS on porosity exhibits clear decrease up to a porosity of about 25 to 27%. At higher porosity, the influence of porosity is less pronounced. This change reflects a change of the deformation mechanism from grain-to-grain sliding in high porosity rocks to grain fracture in lower porosity rocks.
Dependence on Young’s Modulus
Young’s modulus provides a better estimate of UCS than does a porosity-lithology model. Deere and Miller conducted landmark experiments showing that UCS is correlated directly with the static Young’s modulus  . Figure 3 shows a plot of UCS vs. measured on a wide range of grain-supported and clay-supported rocks. Note that the UCS of GS and CS rocks follow a similar trend, and that detects the variation of UCS measured in the SFE#2 well. A comparison of Figure 2 and Figure 3 shows clearly that the static Young’s modulus is a better predictor of UCS than is the porosity-lithology model. The reason is that Young’s modulus carries information about both porosity and grain-to-grain cementation.
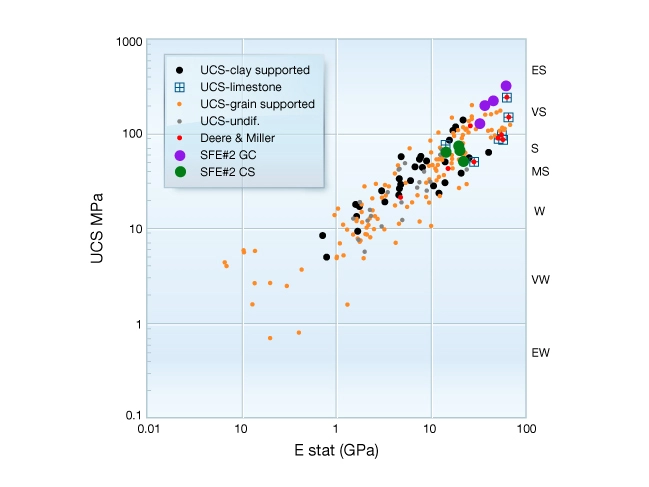
A geophysical estimate of UCS from Young’s modulus requires simultaneous measurements of \( V_p,\ V_s \), and bulk density plus a correction from dynamic to static modulus as seen in Figure 3. If no correction is made, UCS will be overestimated.
Tensile Strength
Tensile strength is calculated from predictions of UCS. The Griffith failure criterion predicts tensile strength varies between 1/8 and 1/12 of the unconfined compressive strength (Logan, 1986). The two-dimensional plane-Griffith theory predicts:

Murrell’s extension of the Griffith criterion to three dimensions predicts:

However, the equation  generally falls within this range for UCS up to about 100 MPa.

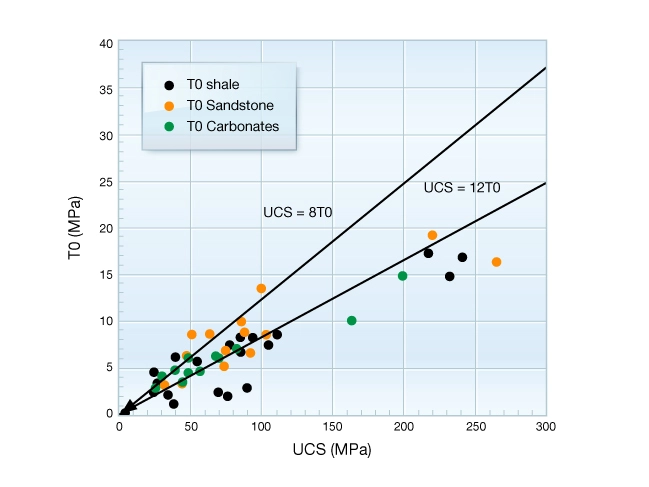
Figure 4 illustrates tensile strength plotted vs. UCS for sandstones, shales, and carbonates. Note that  increases with UCS and that no systematic dependence on lithology is apparent. This dataset suggests that tensile strength,
  is a reasonable approximation for rocks with UCS up to 100 MPa. But that
  is a better approximation over the full range of UCS. The Griffith predictions are shown for reference. Note that increases with UCS and that no systematic dependence on lithology is apparent.
Friction Angle
Friction angle characterizes the dependence of compressive strength on effective confining stress. Studies of strength measurements made on siliciclastic rocks show that friction angle tends to decrease as porosity and clay content increases. Figure 5 illustrates the variation of friction angle with the volume fraction of siliciclastic grains, \( V_{grain} \), defined as:

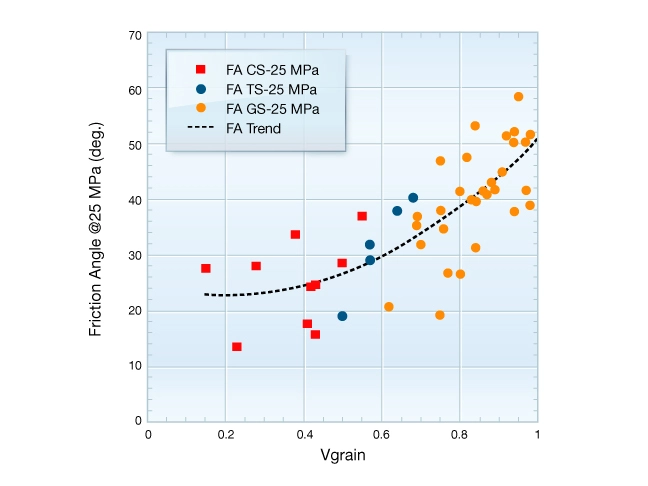
Grain-supported (GS) and clay-supported (CS) materials are distinguished in this figure. Friction angle of grain-supported material decreases rapidly as porosity and clay content increase (orange data points). The rate of decrease lessens when clays become the continuous load-bearing solid. Therefore, it is possible to estimate friction angle for siliciclastic rocks, given measurements of porosity and clay content made by geophysical logs.
Unfortunately no equivalent study for carbonate lithologies has been published.
Brittle-Ductile Transition of Sandstones
Knowing whether failure will lead to a loss or an increase in load bearing capacity has practical implications for petroleum engineers. Brittle materials lose most of their load-bearing capacity when they fracture, either along macroscopic shear planes or at grain contacts or both. Deformation of ductile materials is characterized by a strain hardening behavior where the load bearing capacity increases as the material strains.
Studies show that the brittle-ductile transition pressure of sandstones decreases with increasing porosity. Figure 6 summarizes published data.
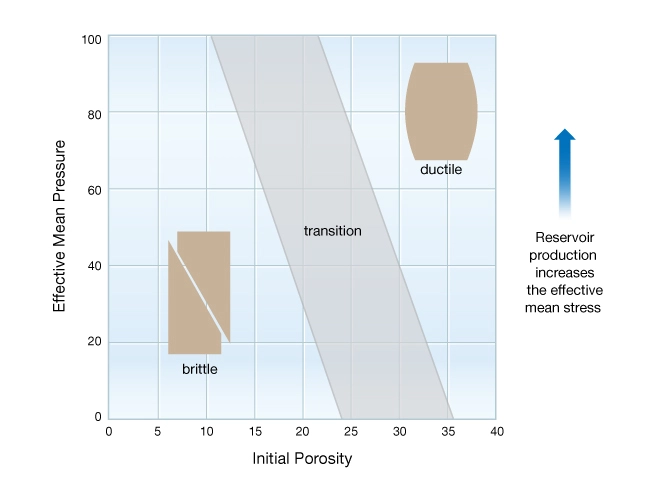
The graph is divided into three fields: brittle, transitional, and ductile. Low-porosity sandstones can be expected to deform in a brittle manner under most reservoir stress conditions. This is where the Mohr-Coulomb failure criterion applies. However, very high-porosity sandstones may be ductile at reservoir stress states. The deformation of materials that plot within or close to the ductile field are better characterized by soil mechanics. The transitional field represents a stress-porosity domain where both brittle and ductile behavior were observed experimentally. This is where many of today’s high porosity reservoir sands plot and where laboratory experiments are needed to determine which failure mode applies.