Related Articles


Brittle Processes
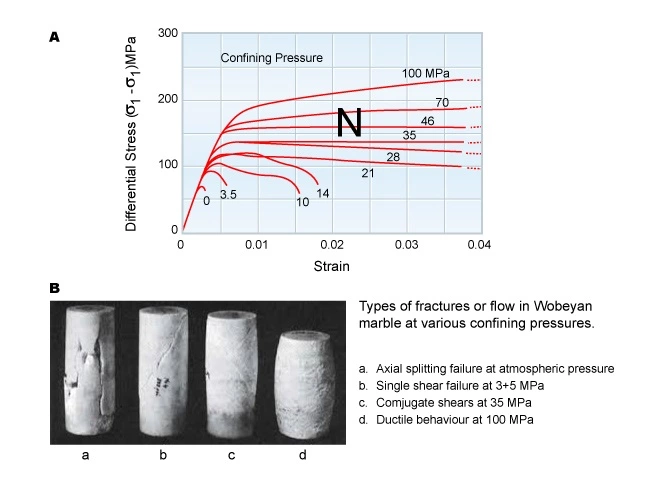
Rocks that deform by fracturing are known as brittle materials (Figure 1 B). For a given loading rate, brittle processes tend to occur at relatively high shear stress and low confining stress (that is, low effective mean stress). In brittle materials, the peak differential stress at the onset of fracturing is called the compressive strength (Figure 1 B).
Modes of Fracture
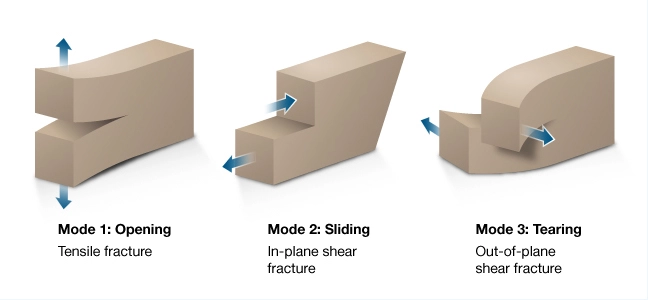
The field of fracture mechanics recognizes three modes of fracture development in elastic solids (Figure 2).
Examples of Modes of Fracture
- Mode 1
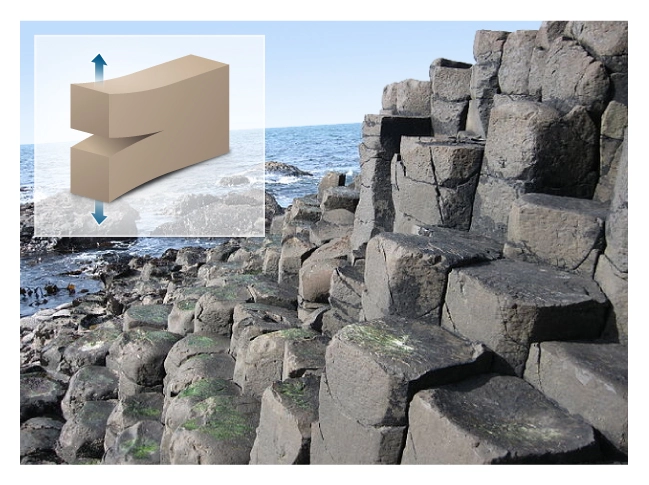
Mode 1 tensile fractures develop in response to stress applied normal to the resulting fracture plane. There is no shear displacement across the resulting fracture plane. Two examples of mode 1 fractures are rock joints (Figure 3) and hydraulic fractures initiated in a wellbore.
- Mode 2
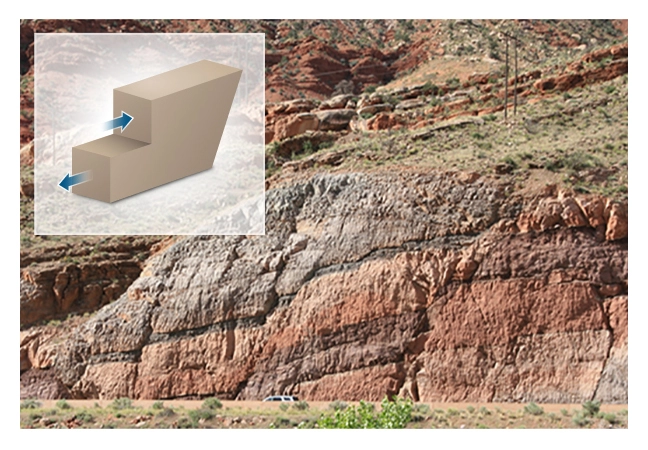
Mode 2 is a shear fracture that develops when a shear stress is applied in the plane of the resulting fracture; in this case the fracture propagates in the direction of applied shear stress (Figure 4).
- Mode 3
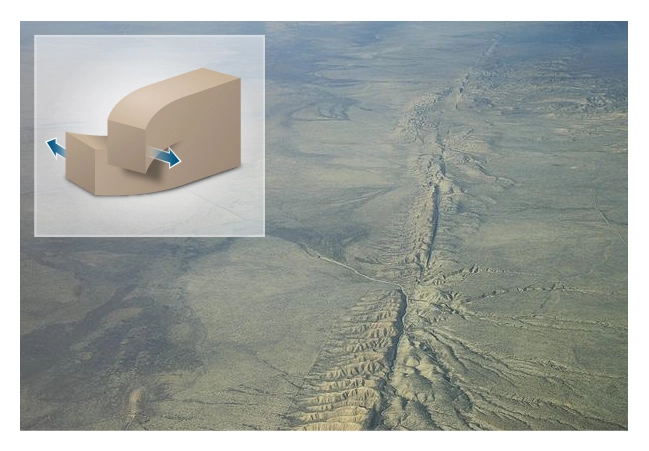
Mode 3 fracture also results from shear stress applied in the plane of the resulting fracture; in this case the fracture propagates perpendicular to the applied shear stress (Figure 5).
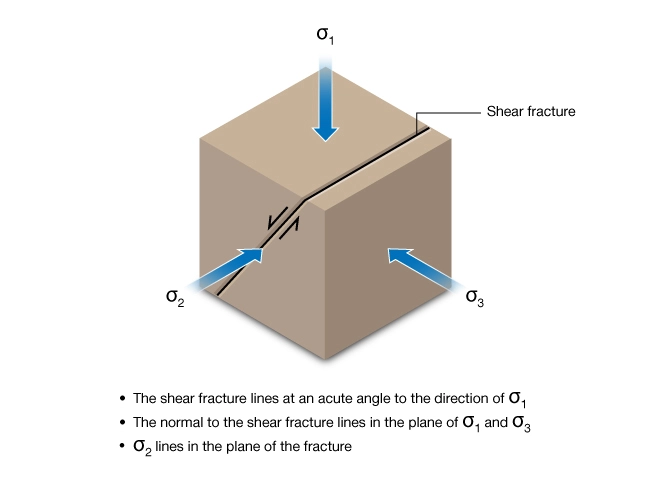
Shear fractures form when the maximum shear stress in the rock exceeds a critical value called the shear strength or compressive strength. Figure 6 shows the general relationship between the three principal stresses and the shear fracture plane. Geologic faults and shear fractures are natural examples of mode 2 fractures. Mode 3 fractures would include faults and shear fractures that also included oblique movement.
The difference between a shear facture and a fault is the magnitude of shear displacement along the shear plane. From a mechanical standpoint the origins are the same.
Tensile Failure Criterion
Tensile fractures form when a normal stress exceeds the rock tensile strength,  .
.

On a Mohr diagram the tensile failure criterion is the locus of points corresponding to a negative normal stress equal in magnitude to  (Figure 7).
Coulomb Shear Failure Criterion
The Coulomb shear failure criterion describes how rock shear strength increases with increases in the least principal stress (that is, confining stress). This dependence of the critical shear stress on confining stress is one of the most fundamental aspects of rock strength, and is common to all rock failure criteria. The intermediate principal stress affects rock strength but it is of secondary importance (Mogi, 1967).
18th century French naturalist Charles Coulomb developed the first quantitative description of rock shear strength. The Coulomb failure criterion is:

Where:
 is the maximum shear stress or shear strength
 is the cohesive strength of the material
 is the coefficient of internal friction
 is the normal stress acting on the potential plane of failure
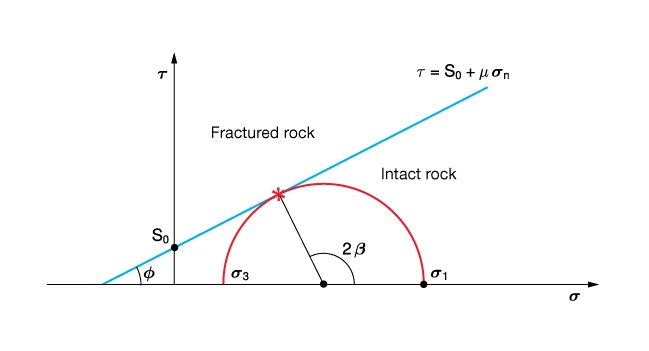
The Coulomb criterion plots as a straight line on the Mohr diagram with constant slope and a intercept at (Figure 8). Both and are empirical parameters that are dependent on the rock’s mineral composition and texture. Both parameters are routinely measured in the laboratory and can be estimated from geophysical measurements.
Mohr Shear Failure Criterion
Mohr generalized Coulomb’s failure theory by stating that strength is a function of stress and is often referred to as the Mohr-Coulomb theory.

The Coulomb criterion is a special case of the Mohr criterion. Extensive laboratory testing of rock strength has demonstrated that the shear failure envelope often is a concave downward curve. A good example of such a concave downward failure envelope is the Hoek-Brown criterion. As a consequence, the friction angle is not a constant but deceases with increasing mean stress.
Amonton’s Law of Friction
Photomicrographs, rock outcrops, borehole imagery, and 3D seismic data all show that most rock masses contain planes of weakness. Under certain conditions, shear displacement is possible at grain-to-grain contacts or on bedding planes, fracture planes, or along faults.
Figure 9 illustrates planes of weakness in contact.
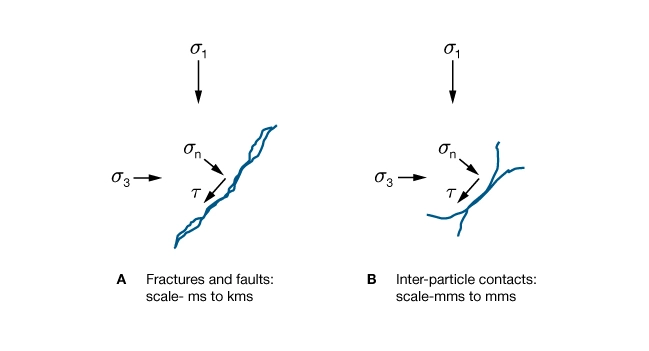
Movement between two surfaces in contact is resisted by frictional forces. This frictional resistance is governed by Amonton’s Law (Figure 10):

Where:
![F_{fric}[latex] is the force exerted by each material on the other <!-- /wp:paragraph --> <!-- wp:paragraph --> [latex]F_n](https://petroshine.com/wp-content/ql-cache/quicklatex.com-ed6047805c6c5d19014f3c929b370980_l3.png "Rendered by QuickLaTeX.com") is the normal force acting perpendicular to the surfaces in contact
is the normal force acting perpendicular to the surfaces in contact
is the coefficient of sliding friction
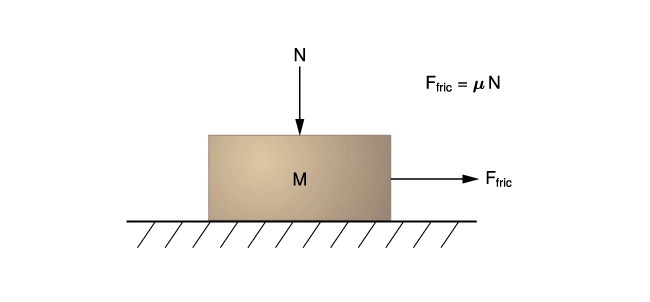
Expressed in terms of stresses, Amonton’s Law can be written as:

Where:
is the shear stress on a plane of weakness
is the normal stress acting on the planes in contact
is the coefficient of sliding friction
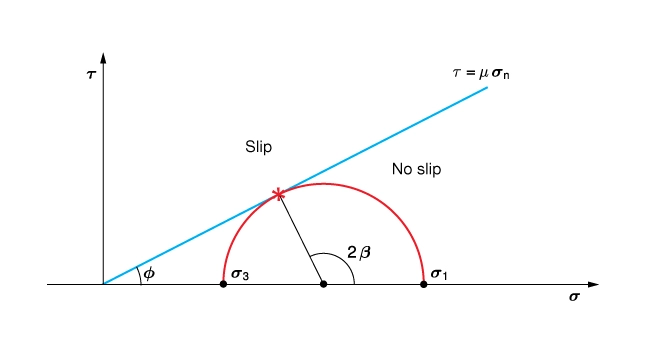
Amonton’s Law plots as a straight line on the Mohr diagram with slope . Notice that the intercept is  (Figure 11). Once a shear fracture has formed or a plane of weakness exists, the maximum shear stress that the weakened rock mass can withstand is only governed by friction.
The symbol appears in the Coulomb failure criterion and in Amonton’s Law; however, the physical interpretation and the numerical values are not the same. Terminology common in geomechanics, rock mechanics, and geophysics uses ϕ as the angle of internal friction, to characterize the dependence of intact rock strength on pressure and as the coefficient of sliding friction, to characterize the frictional strength of surfaces in contact.
Referring to Figure 9:

The Coulomb criterion expressed in terms of the internal friction angle is: