Related Articles

The Evolution of Seismic Technology
Evolution of Seismic Technology Overview
Oil and natural gas are found in the earth’s subsurface in what are known as reservoir rocks. These rocks include sandstone, which is uniquely suited to hold oil, natural gas, and water between the grains of sand. The space between the grains of sand are referred to as pore spaces.
Geophysical technology is used to find these oil and natural gas reservoirs. Sound waves are sent deep into the earth and when they bounce back, can be detected using instruments called geophones, and data is then collectively gathered in the recorder truck (Figure 1).
Geophones are electronic recording devices that capture a signal when sound from a point source, in this case a vibrator truck, is echoed or reflected off subsurface boundaries between rock types. When thousands of these signals are put together in a line, a slice, or a cross section of the earth, visible subsurface structures can be seen. This is what is known as 2-dimensional (2D) seismic section.

When the data has been collected and processed, interpretation includes identifying structural features and delineating the lateral and vertical extent of the reservoir (Figure 2).

Seismic Technology Foundations
In all three seismic disciplines – acquisition, processing, and interpretation – the tools for obtaining seismic data have greatly changed throughout history.
In the past, acquiring seismic data depended on dynamite and exploring places accessible by foot or truck (Figure 3). Today all-terrain vehicles (Figure 4) with state of the art recording equipment are used in difficult terrain. Marine data can be recorded in the deepest of seas by seismic ships (Figure 5) that travel out to sea for weeks at a time.


Seismic Specifications
There are two methods for collecting seismic data: seismic imaging (Figure 6) and seismic well logging (Figure 7).


Seismic Imaging
Seismic imaging is used to map the subsurface distribution of stratigraphy and its structure, which can be used to delineate potential hydrocarbon accumulations.
Historically, seismic data was recorded in the field on large tapes (Figure 8) and sent to a geophysical processing team to convert the data to a seismic image. It would take weeks to create a single 2D seismic section.

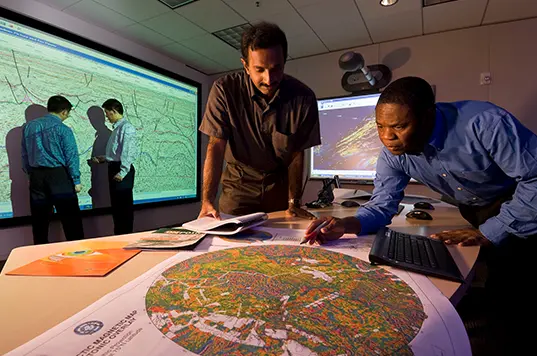
Today, initial seismic images are often created in the field, by an onsite field geophysicist, to verify acquisition parameters are adequate and the data meets established quality standards, usually specified by the client. Refinement of the data and production of more sophisticated images are performed in the office, by processing geophysicists who have enormous compute power at their disposal. Interpretation of seismic data has evolved from analyzing the shape of a series of wiggles – 2D seismic section – to analyzing every attribute of the seismic wave – 3D volumes and 4D seismic acquisition. (Figure 9)
Seismic Imaging Types
Seismic imaging includes three types of imaging: 2D, 3D, and 4D.
2D Seismic Sections
Early in the history of seismic technology, 2D seismic sections were used to identify structural features, such as anticlines and faults, in the subsurface. A series of source points-shot points or detonation points-and geophones would be laid out in a line where refraction and reflection data would be collected to create a slice, or a 2-dimentional image of the subsurface (Figure 10).
Figure 10 shows a structure similar to an anticline, represented by the blue line. There are some surfaces, or potential breaks between rock types, that are also visible and appear to be present across the entire field of view, represented by the green line.
It would take several of these single lines of section, or slices, both parallel and perpendicular to each other, to create a 3D picture of the subsurface, and there would still be data gaps between those slices. 2D seismic data is still widely used in the exploration phase as a cost-effective means of gathering substantial data. Depending on the project scope, 2D seismic data may still be collected, but collection of 3D seismic data has become normal practice over the last decade.

3D Seismic Volumes
Acquisition of 3D seismic volumes involves source points and geophones set out in a grid pattern over a field. Collected 3D seismic data provides a much higher resolution than 2D seismic data. 3D data also provides volume data that allows an interpreter to scan through the data and eliminate, or minimize, gaps. Figure 11 illustrates the resolution that can be achieved with 3D seismic data. Note the outline of an anticline (blue line) and very distinct faults (orange lines) that may not be seen in 2D seismic data captures. In this example, the surfaces (green lines) are actually faulted and the hydrocarbon accumulations may be compartmentalized between these faults (within the red box).

4D Seismic Acquisition
4D seismic acquisition is a series of seismic surveys that are acquired, processed, and interpreted over different time intervals during the life of a producing field. This is important to field management over time. 4D seismic imaging helps in understanding where fluids have moved, which aids in deciding if additional wells need to be drilled, and where, or if water and/or gas injection wells should be drilled.
In a mature field, a field that has been producing for more than a decade, this form of management is known as depletion planning. 4D plays a major role in depletion planning to assist with decisions that involve production of hydrocarbons.

Seismic Imaging Example
In 1959, the first 2D seismic test was carried out in Prudhoe Bay, Alaska. The area and test became known as the Prudhoe Bay structure. The resulting 2D seismic image identified an anticlinal structure located 8,200 feet below the earth’s surface.
The Prudhoe Bay oil reservoir was later confirmed by the first discovery well in 1968. 3D seismic techniques at that time aided in the estimation of 10 billion barrels of oil. Oil production in Prudhoe Bay began in 1977. Over the 30 year history of this field, the knowledge gained from 4D seismic techniques in acquisition, processing, and interpretation improved well placement and depletion planning. As of 2012, the Prudhoe Bay field has surpassed 12 billion barrels of oil production and remains the largest oil producing field in the United States.
Prudhoe Bay has seen gradual production decline into the 2000s. However, technology such as 4D seismic has increased the field’s reserves potential over time (Figure 13). Future drilling and production technology need to evolve to the level of 4D seismic output so that potential reserves can be produced in the future.

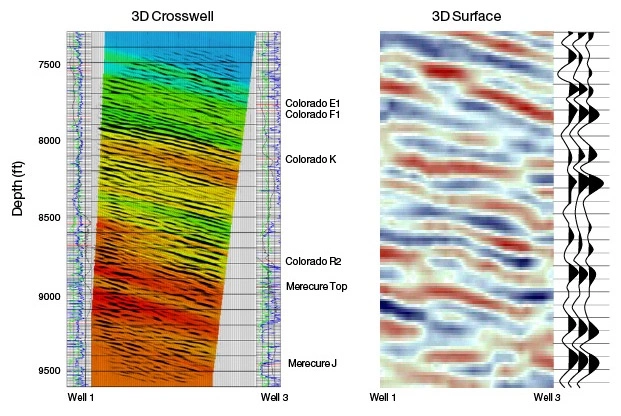
Seismic Well Logging
Seismic well logging, also known as vertical seismic profiling (VSP), is an alternative data collection technique to seismic imaging. In seismic well logging, the receivers are located within the borehole and the source is located in varying configurations around the well. This general form of seismic well logging provides high resolution visual information about rock and fluid properties in a vertical, or even a deviated, well section. However, this method is limited in areal extent because most of the information is gathered within a small radius around the well. For this reason, 3D and 4D seismic imaging techniques are more commonly used. Despite this limitation, VSP can be used to confidently verify 3D surface seismic data. Many different patterns are used to obtain seismic well logging results, including:
- Zero offset VSP
- Offset VSP
- Deviated well VSP
- Walkaway VSP
- 3D VSP
Seismic Well Logging Patterns

In zero offset VSP, the source is in close proximity to the wellbore directly above the receivers, where seismic waves travel vertically down to a reflector and then up to the receiver (Figure 14).

In offset VSP, the source a predetermined distance away from the receivers and a collection of seismic receivers is clamped in the borehole (Figure 15).

In deviated well VSP, multiple sources are aligned vertically above the receivers in a deviated wellbore (Figure 16).

In walkaway VSP, the source is moved incrementally in a line on the surface away from a stationary receiver to create a pseudo 2D line (Figure 17).

In 3D VSP, the source lines are in a grid (on land) or a spiral pattern (offshore) above the receiver (Figure 18).