Related Articles
Sources of Data for Mechanical Earth Model
Data sources are presented in the order that information evolves in a new prospect.
- Geological data
- Seismic data
- Drilling data
- Borehole measurements
- Rock samples
Geological Data for Mechanical Earth Model
Geologic data establish regional or basin-scale constraints on the geomechanical model. Of particular interest are the tectonic history, basin burial history, and regional stratigraphic correlations. Much of this general information can be found in scientific journals. More site-specific information is found in company reports and in publically available offset well data. Table 1 shows how certain geologic data contribute to the geomechanical model.
| Framework Model | Mechanical Stratigraphy | Mechanical Properties | Pore Pressure | Principal Stresses | Stress Directions | |
|---|---|---|---|---|---|---|
| Burial history | ✔ | ✔ | ||||
| Tectonic history | ✔ | ✔ | ✔ | |||
| 3D geologic model | ✔ | ✔ | ||||
| Earthquake fault plane solutions | ✔ | ✔ | ||||
| World stress map | ✔ | |||||
| Basin model | ✔ | ✔ | ✔ | |||
| Stratigraphic column | ✔ | ✔ | ||||
| Depositional environment | ✔ | ✔ | ||||
| Core description | ✔ | ✔ |
Seismic Data for Mechanical Earth Model
Surface seismic data provide structural and rock property information over the entire volume of interest. Seismic data are important for four reasons.
- Seismic data often provide the only elastic property data in the uppermost kilometer of depth. This is a particularly important zone in deepwater settings.
- Seismic data reveal the spatial distribution of rock elastic properties. Interpretation of these properties defines trends in gross lithology, porosity, and pore pressure.
- Seismic data provide the only measurements below the reservoir level. Such data are needed when constructing 3D and 4D geomechanical models.
- A pre-drill MEM constrained by geologic and seismic data is calibrated using check shot and logging while drilling (LWD) velocity data acquired while drilling exploration wells.
Table 2 shows how seismic data contributes to the geomechanical model.
| Framework Model | Mechanical Stratigraphy | Mechanical Properties | Pore Pressure | Principal Stresses | Stress Directions | Seismic Data |
|---|---|---|---|---|---|---|
| ✔ | 3D Seismic cube | |||||
| ✔ | 2D seismic profiles | |||||
| ✔ | ✔ | Formation tops | ||||
| ✔ | ✔ | ✔ | Structural interpretation | |||
| ✔ | Sequence stratigraphy | |||||
| ✔ | ✔ | ✔ | ✔ | ✔ | AVO analysis | |
| ✔ | ✔ | ✔ | Tomographic velocity model | |||
| ✔ | ✔ | ✔ | ✔ | VSP checkshot |
Drilling Data for Mechanical Earth Model
Drilling data from exploration wells provide the earliest quantitative information about subsurface rock formations. These data extend from earth’s surface to the base of the reservoir. The location of seismic reflectors, gross changes of lithology, and constraints on pore pressure can be found in the daily drilling reports. Frequent trips in and out of the hole provide information about the location and nature of rock deformation, failure mechanisms, and time-dependent behavior. Leakoff tests or formation integrity tests place constraints on principal stress magnitudes. Occasionally, large fragments of rock are transported to the surface in the drilling fluid or lodged in logging tools. These fragments, called cavings, provide evidence of rock failure mechanisms for a specific lithology. Often, cavings are large enough to supply samples for laboratory mechanical property tests. Table 3 shows how drilling data contribute to the geomechanical model.
| Framework Model | Mechanical Stratigraphy | Mechanical Properties | Pore Pressure | Principal Stresses | Stress Directions | Drilling Data |
|---|---|---|---|---|---|---|
| ✔ | ✔ | ✔ | Daily drilling reports | |||
| ✔ | ✔ | Daily geologic reports | ||||
| ✔ | Daily bit reports | |||||
| ✔ | ✔ | ✔ | ✔ | End of well reports | ||
| ✔ | Formation integrity test | |||||
| ✔ | Leakoff test | |||||
| ✔ | Extended leakoff test | |||||
| ✔ | Directional surveys |
Borehole Measurements for Mechanical Earth Model
Logging while drilling (LWD) and wireline measurements provide high-resolution geophysical data from the near surface to the base of the reservoir. Deep reading LWD data are acquired in large hole sizes (17 1/4″) including gamma ray, resistivity, and  . Additional measurements available in 12 1/4″ in diameter holes and smaller include: borehole images, bulk density, and and
  . LWD data are particularly valuable because they are less sensitive to wellbore instability and they can provide evidence of time-dependent deformation. Table 4 shows how borehole measurements contribute to the geomechanical model.
| Framework Model | Mechanical Stratigraphy | Mechanical Properties | Pore Pressure | Principal Stresses | Stress Directions | Borehole Data |
|---|---|---|---|---|---|---|
| ✔ | ✔ | ✔ | ✔ | ✔ | Borehole images | |
| ✔ | ✔ | GR | ||||
| ✔ | ✔ | Lithology interpretation | ||||
| ✔ | ✔ | Oriented multi-arm caliper | ||||
| ✔ | ✔ | ✔ | ✔ | Bulk density | ||
| ✔ | ✔ | Deep Resistivity | ||||
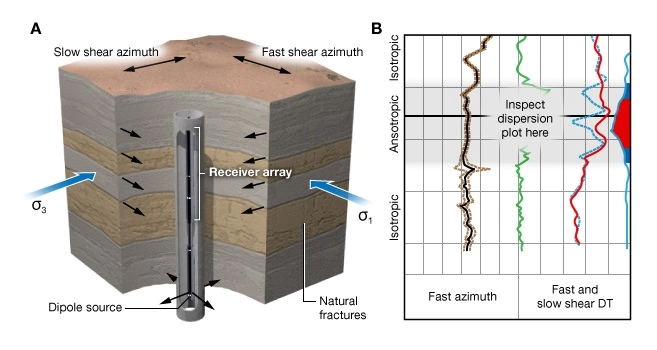
| ✔ | ✔ | ✔ | Monopole, | |||
| ✔ | ✔ | Dipole fast & slow | ||||
| ✔ | ✔ | Fast shear azimuth | ||||
| ✔ | Dipole dispersion analysis | |||||
| ✔ | ✔ | Stress measurement | ||||
| ✔ | ✔ | Formation pressure |
Rock Samples for Mechanical Earth Model
Rock samples provide the ground truth for predictions about rock type and rock properties. Samples of rock, in one form or another, are available over the entire depth of a well. Table 5 describes the subsurface rocks and their sources.
| Type | Spatial Domain | Typical Sizes | Description |
|---|---|---|---|
| Cuttings | Overburden Reservoir |  1mm 1mm | Product of the drilling process |
| Cavings | Overburden Reservoir | 1-20 cm | Product of wellbore instability |
| Cores | Reservoir | Diam. 10-15 cm, L. 9 m | Conventional coring |
| Sidewall cores | Reservoir | Diam. 2.5 cm, L. 8 cm | Rotary sidewall coring tool run on wireline |
Drill Cuttings and Cavings
Drill cuttings record the lithostratigraphy of rocks penetrated by a well. However, one disadvantage shared by cuttings and cavings samples is that their depth of origin is often not well known. Subsequent log interpretation can constrain the depth of origin, however.
Rotary Coring
Rotary coring is the main source of rock samples large enough for laboratory study. Conventional coring uses a core barrel deployed on drill pipe. Cores provide a continuous, typically undisturbed, record of rock over the cored interval within a reservoir. Whole cores are most suitable for rock mechanical property tests because they are large enough to provide multiple test samples with different orientations relative to bedding.
Rotary Sidewall Cores
Rotary sidewall cores are available using wireline tools. Sidewall cores are typically about 2.5 cm in diameter and 5 cm in length. Unlike conventional rotary coring, the axis of sidewall cores is perpendicular to the well axis. The precise depth and azimuth of the sidewall cores can be determined from analysis of borehole images.
An advantage of sidewall cores is that they can target specific formations of interest identified using previously acquired wireline logs. Another advantage is that many samples can be acquired over a large depth range on a single trip into the well. Rock mechanical properties are obtained on sidewall cores using the multistage test protocol. Testing horizontal plugs provides sufficient mechanical property data if it is assumed that the rock is isotropic. If the rock is anisotropic the mechanical data will be incomplete but still useful. Table 6 shows how rock samples contribute to the geomechanical model.
| Framework Model | Mechanical Stratigraphy | Mechanical Properties | Pore Pressure | Principal Stresses | Stress Directions | Rock Sample Data |
|---|---|---|---|---|---|---|
| ✔ | Drill cuttings | |||||
| ✔ | ✔ | Cavings | ||||
| ✔ | ✔ | ✔ | Whole core | |||
| ✔ | ✔ | Sidewall cores |