Deriving Lithology From Porosity Logs
A number of different LWD and wireline well logs can be used as indicators of the formation lithology. Some of the more useful logs for this purpose are the main porosity logs:
- Density: bulk density and photoelectric factor data
- Neutron porosity
- Sonic
The following logs, often acquired in the same logging suite, confirm the lithological identifications from the porosity logs:
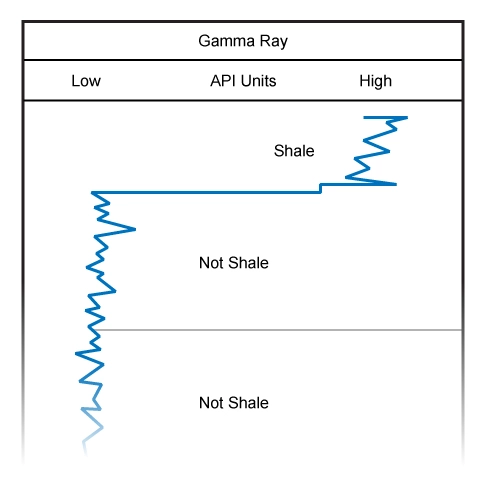
- Natural gamma ray (Figure 1) and spectral gamma ray
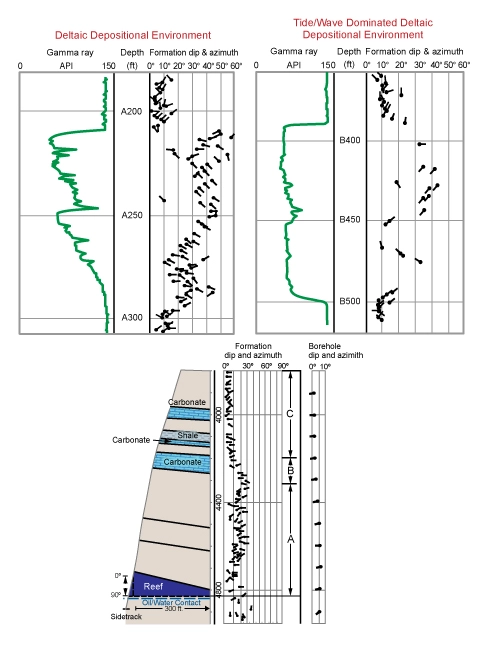
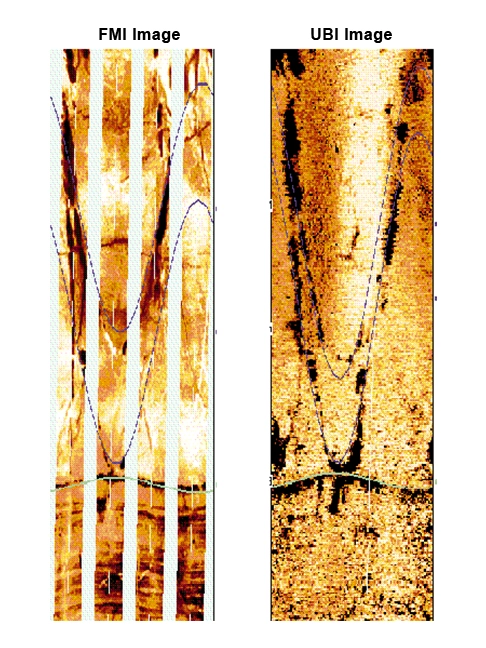
- Dipmeter (Figure 2) and borehole imagers (Figure 3)
interpretation
With the exceptions of the photoelectric factor measurement, Pe, acquired in conjunction with a density log and to some limited extent the spectral gamma ray, no single porosity tool measurement will, by itself, give a direct indication of the formation lithology. (However, it should be noted that any significant amount of barite in the drilling mud invalidates the photoelectric factor as a lithology determinant.)
We can, however, derive useful lithology information by using combinations of porosity tool measurements. The most useful combinations are often:
- Crossplots of data from two porosity logs: bulk density versus neutron porosity; bulk density versus interval transit time from sonic logs; and interval transit time versus neutron porosity
- The “M” and “N” (M-N) plot
- The “MID” plot
- One, or more, of the above with the photoelectric factor, Pe
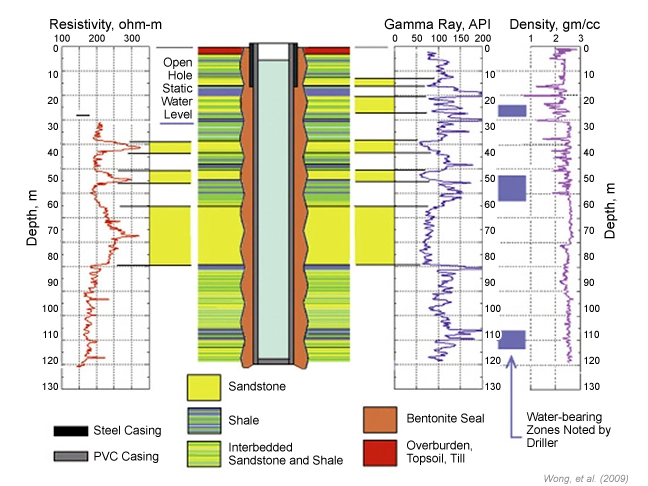
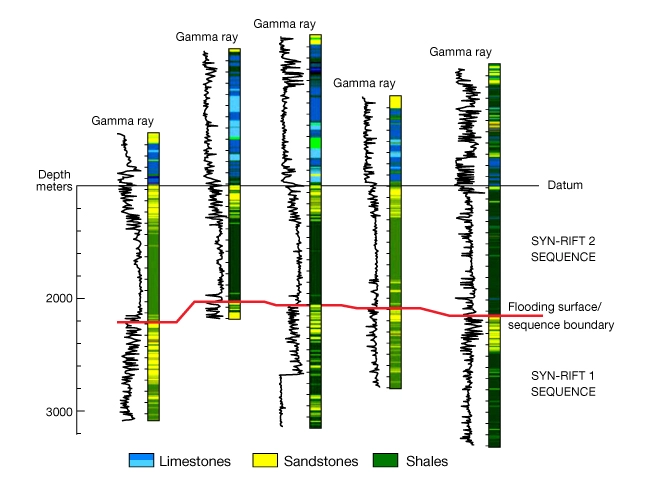
It is often possible to play back digital porosity logs (Figure 4) at a specific scale that gives a visual indication of the rock type. In mixed lithology sections, it is essential to identify the rock type to choose the correct parameters needed to perform other log analysis calculations for the porosity and water saturation. Correct identification of the lithology will also assist in well to well correlations (Figure 5).
Lithology From Density-Neutron Porosity Crossplots
The density-neutron porosity crossplot has slightly different templates for use with different types of water base drilling muds.
Crossplot Templates Based on Drilling Muds
The crossplot shown in Figure 6 is used in conjunction with fresh water base mud filtrates, with mud filtrate density, ρf = 1.0.
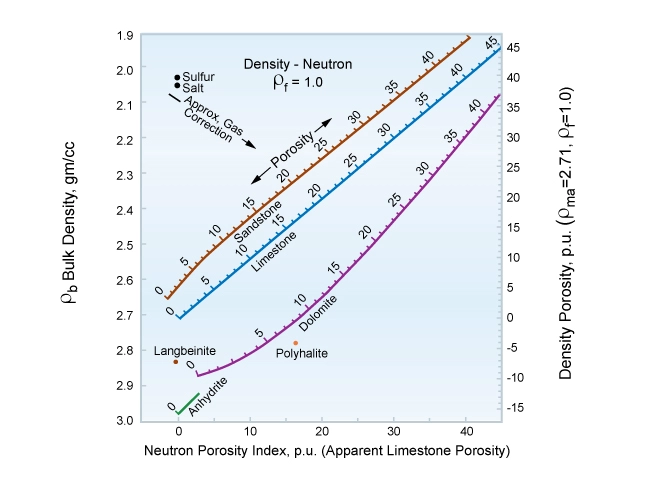
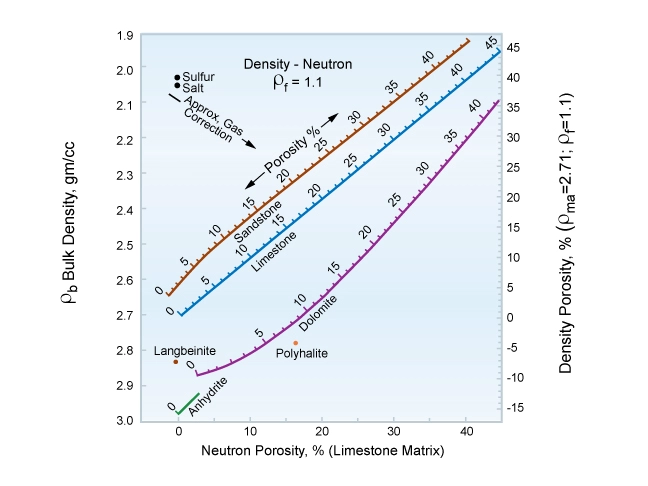
The differences between the two templates are minor. In the case of oil base drilling muds, another slightly different density-neutron crossplot template applies as the mud filtrate density again is slightly different. The lithologies are indicated by the location of the well log data on the crossplot template. The positions of a number of non-porous minerals, such as salt, are shown on these charts as discrete points. However, the porous sandstone, limestone and dolomite rocks appear as lines, covering the range of porosities normally encountered in subsurface reservoir rocks. Shales typically fall to the southeast of the sandstone matrix line (Figure 8). With compaction due to increasing burial depth, the shale density similarly tends to increase steadily.
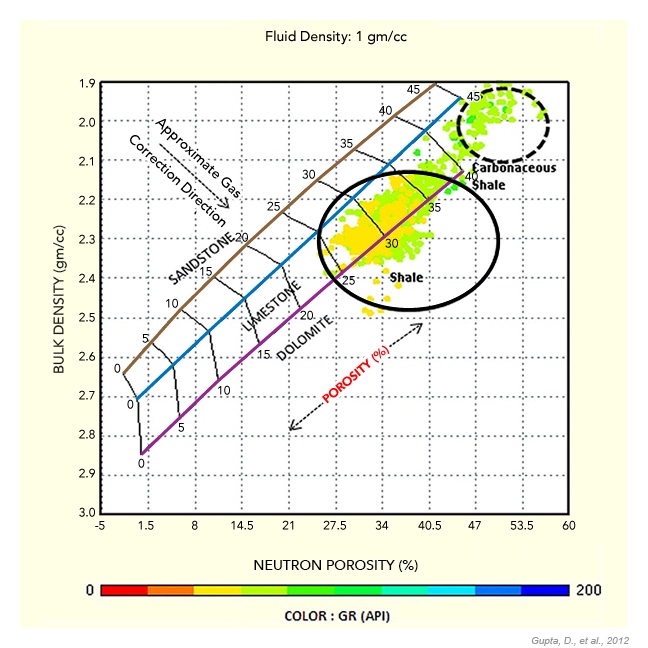
It is possible to linearly scale off the shale content, termed shale volume or Vshale (Vsh), between the shale point and the clean sandstone line, to establish a shale volume percentage for each formation data point (Figure 9). As a result, a formation can be described as having both a certain shale volume percentage and another percentage of rock matrix, sandstone or carbonate content.
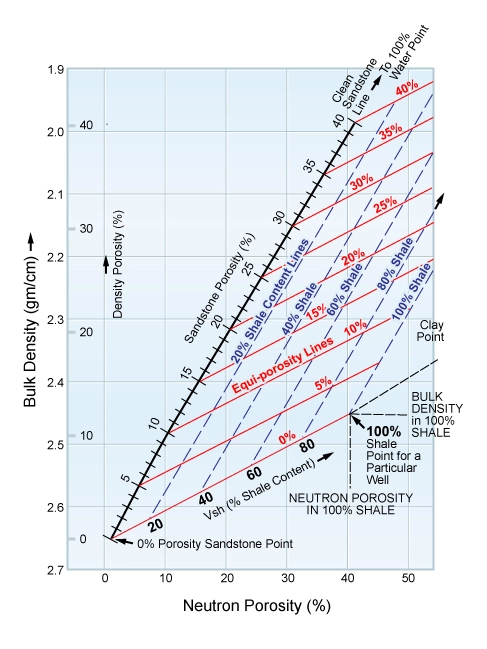
Figure 10 is a density versus neutron porosity crossplot of an interval of dolomitized limestone. Some of the lower porosity intervals of this formation are nearly all dolomite, plotting on, or very close to, the dolomite matrix line. The crossplot shows variations in the degree of dolomitization and the effect on the porosity.
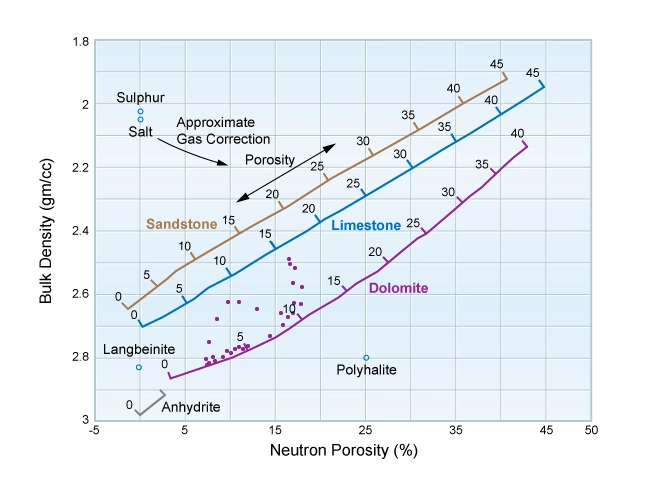
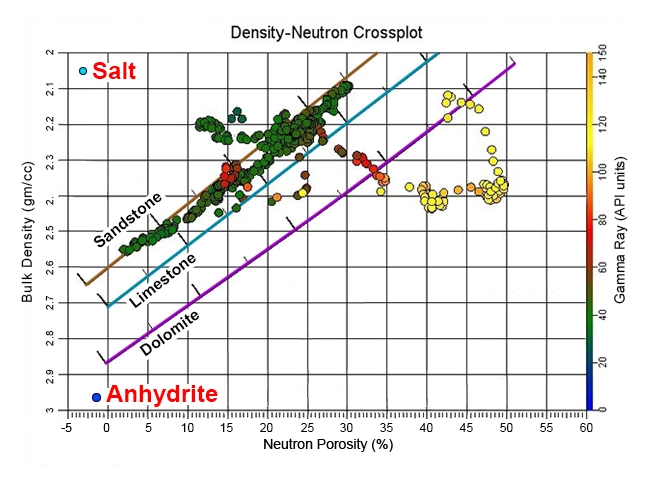
Figure 11 shows where pure rock salt, often termed halite, and anhydrite plot on a density-neutron crossplot, clearly differentiating these evaporitic intervals from shales, as well as from sandstones and carbonates.
A digital log playback on compatible limestone scales can often provide lithological information (Figure 12).
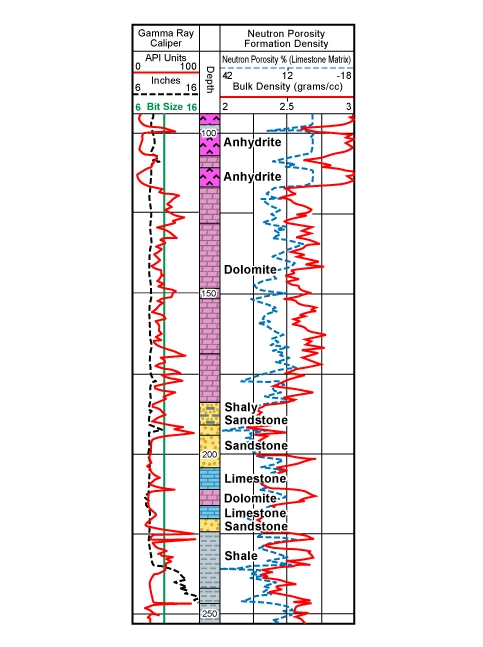
Note that the scale for the density log in in Figure 12 is from 2 to 3 gm/cc across tracks 2 and 3. The neutron porosity, in limestone porosity units, is scaled from 42% to -18% across the same tracks. The 0% limestone point thus coincides for both the density and neutron porosity logs at four, small chart divisions from the left hand side of Track 3. (Track 3 is the right half of the double track to the right of the depth track.)
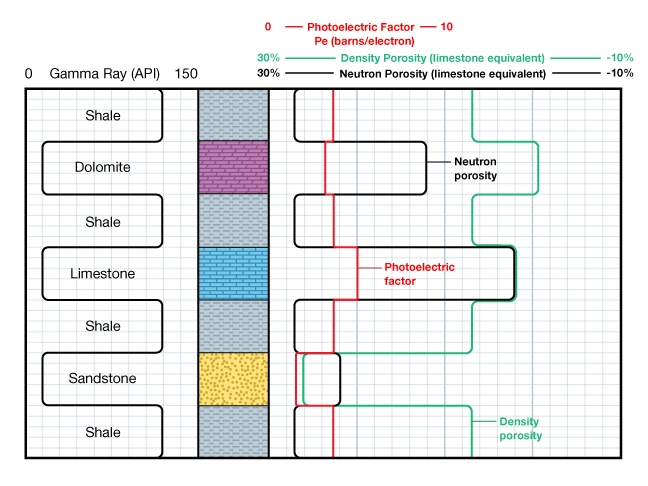
Where the neutron porosity curve lies to the right of the density curve, a sandstone matrix is inferred. This corresponds to the area to the northwest of the limestone line in Figure 6. When the two coincide, limestone is indicated. Alternatively, playbacks of digital neutron porosity and density porosity data, ideally also with the photoelectric factor, can prove useful for lithology definition (Figure 13).
Lithology From Neutron Porosity-Sonic Crossplots
Another frequently used crossplot is the neutron porosity plotted versus the sonic, or acoustic. When a density log is missing, or has unreliable data due to rugose borehole conditions or logging tool malfunction, this crossplot can be a usable, although inferior, substitute. Figure 14 illustrates the neutron-sonic crossplot.
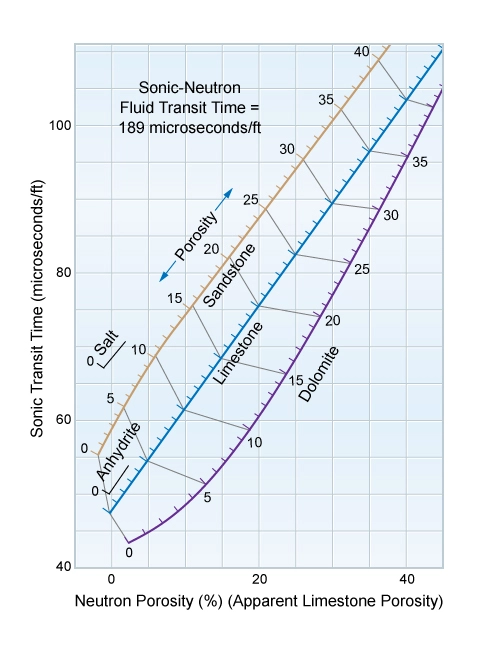
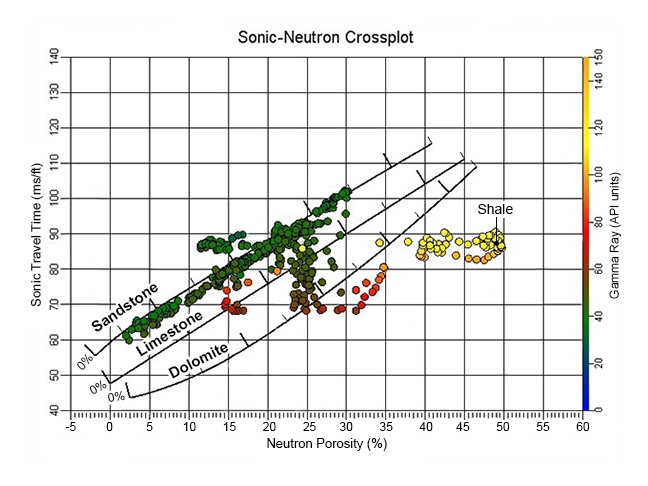
It is used in a similar way to the density-neutron crossplot. Again, shales typically fall to the southeast of, or near, the dolomite matrix line. Figure 15 is a neutron porosity versus sonic porosity crossplot showing two different types of shale, with their different responses on the neutron porosity and sonic well logs.
Lithology From Density-Sonic Crossplots
The final combination of the trio of the porosity log pair combinations is the density-sonic crossplot (Figure 16).
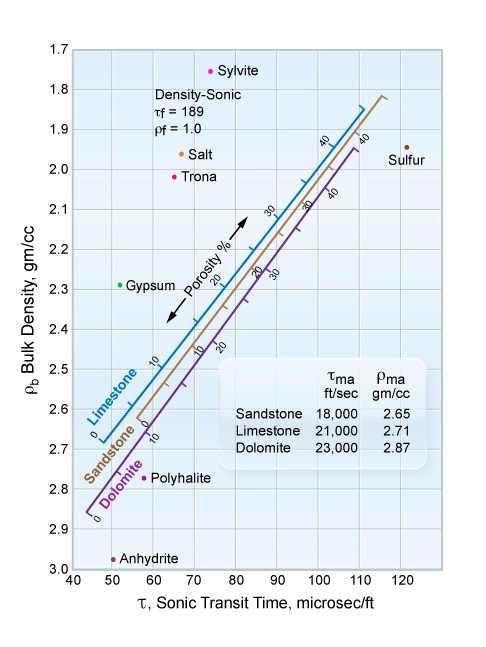
This plot is particularly useful in identifying accessory minerals. Because the sandstone, limestone and dolomite matrix lines are all close together on the crossplot, it can be useful for determining shale content in mixed lithology sediments.
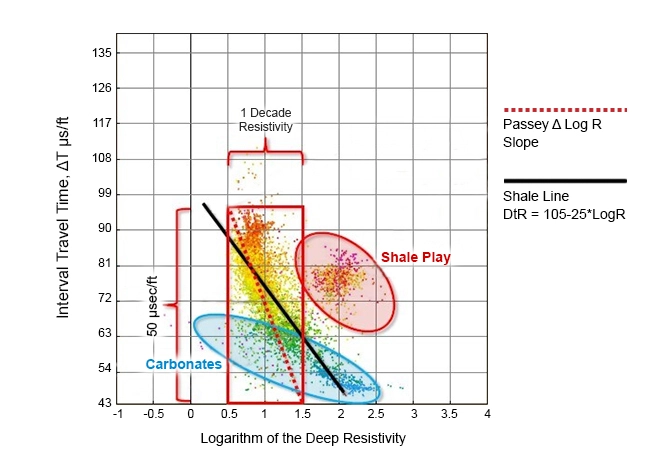
Unconventional resource plays, such as shale oil and shale gas plays, can be identified on crossplots (Figure 17).
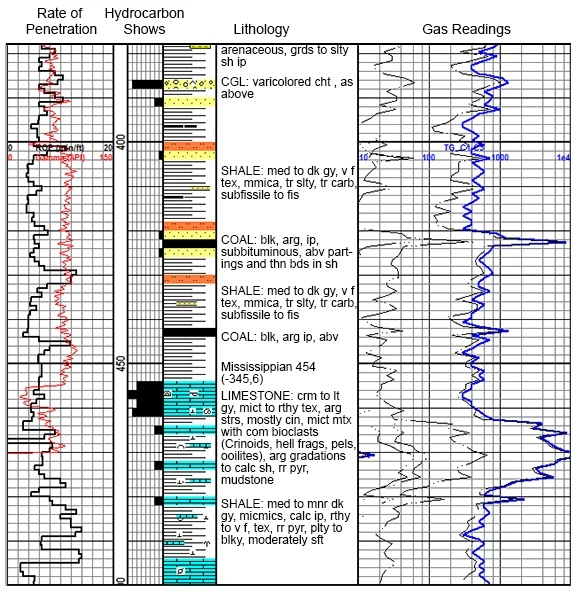
Whichever crossplot is used for lithological interpretation, it is essential to verify the petrophysical analysis with any available core analysis data. Using all the available well logs, mud logs, drill cuttings, full diameter core and sidewall core data, enables a comprehensive reservoir characterization and lithological description (Figure 18).
An Alternative Technique: Multi-Mineral Elemental Analysis
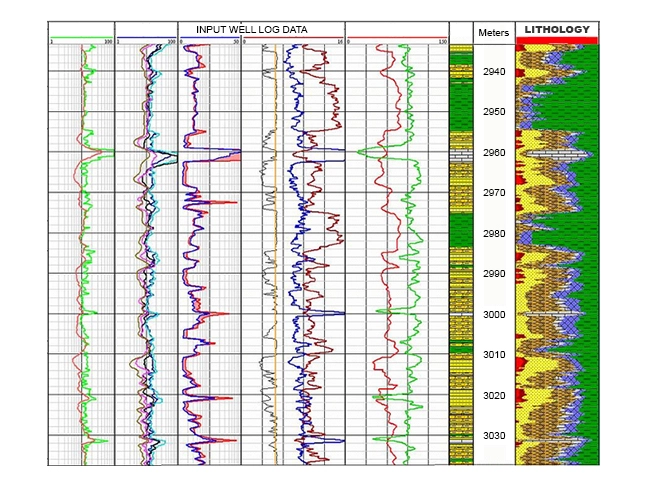
As a contrast to deterministic log analysis techniques, multi-mineral elemental analysis well log interpretation techniques for log data enable detailed lithological interpretations, as shown in the right-hand part of Figure 19. These analyses compute the most probable formation lithology, mineralogy and pore fluid volumes using a multi-log, least squares inversion technique. Such petrophysical techniques are most applicable in reservoirs of mixed lithologies and mineralogies, as well as in dual porosity reservoir systems. However, the correct identification of the minerals likely to be encountered is critical in order to constrain the number of possible solutions and generate a plausible log interpretation.
 Petro Shine The Place for Oil and Gas Professionals.


