Related Articles

Attribute Applications
This subject contains examples of how the application of attribute analysis helps exploration efforts to become more focused and precise when determining exploration targets. The first example is from South Texas and shows how small contrasts in acoustic impedance values and significantly lower Poisson’s ratios, along with far-offset stacks, can indicate gas-bearing horizons. The second example provides an application of the techniques of AVO analysis based on linear fit to calculate attributes, which are used and interpreted through crossplot in prospecting for gas.
Example 1: South Texas
Gregg and Bukowski (2001) published an interesting paper on the application of AVO analysis for locating exploration wells in the clastic Oligocene Vicksburg Formation in South Texas.
South Texas Example of AVO Application
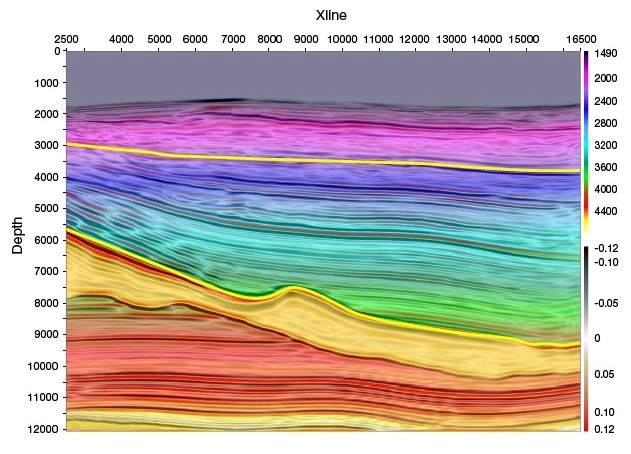
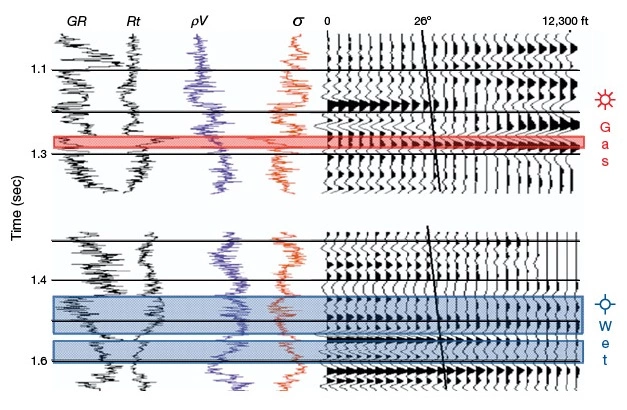
Figure 1 illustrates two different prospects with similar geological conditions. Only the well drilled in the top prospect resulted in a gas producing well. This result triggered the search for a better discriminating approach before drilling.
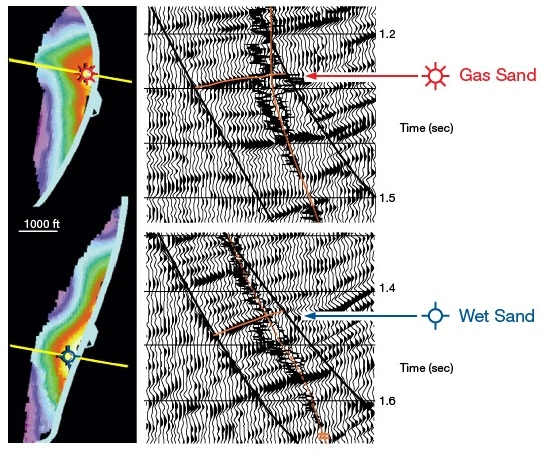
Figure 2 shows small contrasts in acoustic impedance values (ρV) and significantly lower Poisson’s ratio (σ) for the gas-bearing horizon.

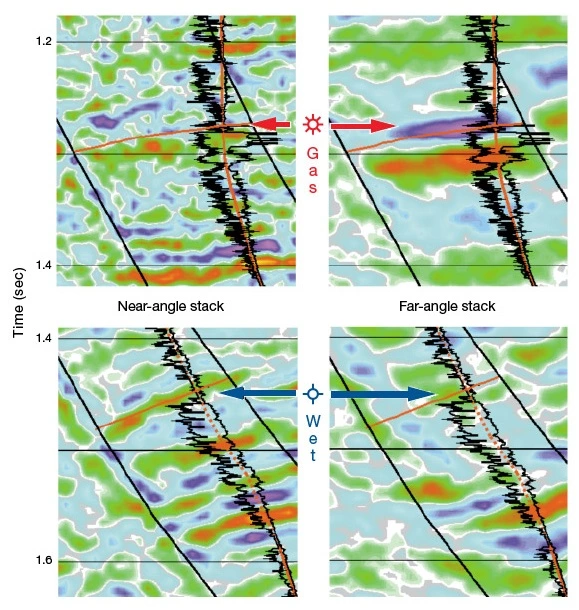
Figure 3 shows modelled CDP (common depth point) gathers to analyze the AVO responses using log data and Verm and Hilterman’s (1995) approximation of Shuey’s equation. A Class 2 gas-bearing sands anomaly is very clear at the far-offset in the producing well, while the water-bearing well shows near-offset positive amplitudes that fade out at far-offsets.
After reprocessing the seismic data, the AVO anomaly in the far-offset was clearly enhanced, as shown in Figure 4.
The results obtained after reprocessing the 3D data encouraged the application of the AVO attribute to the full field, revealing a number of new anomalies to be drilled (Figure 5).

Example 2: Coast of Veracruz, Mexico
In this section, we will highlight some of the results of Malcotti et al. (2004) on the analysis of AVO anomalies from the Kosni Gas Field. The paper discussed an application of the techniques of AVO analysis based on linear fit to calculate attributes (Shuey, 1985), which are used and interpreted through crossplot in prospecting for gas. It also discusses recent techniques for multidimensional classification of attributes in prospecting for gas.
The Kosni Field is located in the waters off the coast of the State of Veracruz, Mexico. The shallower sands belong to the Upper Pliocene, and have average porosities of 22%, with bright spots observed in the stacked, migrated seismic image. The deeper targets belong to the Miocene sands. These are fine-grained and more consolidated, rich in clay (40-50%), calcite, and illite. They also contain potassium, a low porosity (18%), and facies sands of a platform edge (from the low-stand system track).
The 3D seismic data from this project was processed preserving amplitudes that were migrated before the stack through a zero-offset algorithm after dip moveout (DMO).
Kosni Gas Field Example of AVO Application
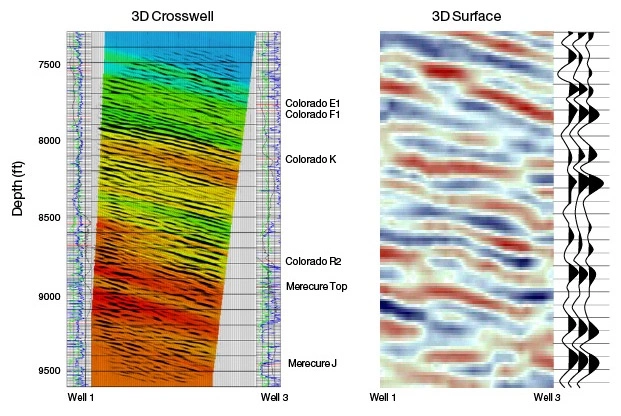
Figure 6 shows the same seismic that has been modeled using three different modeling techniques to highlight a water or gas response at Sand 13. Place your mouse over or tap the letters below each image for more information.

A: Modeling with the Aki-Richard equation and 100% water
B: Full wave equation 1D modeling with multiples
C: Modeling with the Aki-Richard equation and 100% gas
Once the synthetic seismograms are calculated, and combined with plotted attributes (intercept [R0] and Poisson’s reflectivity [PR] for the AVO interpretation) on real CDPs, the calculation of AVO attributes can be done by analyzing crossplots (Figure 7). The results shown are as reported from the literature by Hilterman, 2001.
The figure shows the rotation and classification of lithology, and the presence of gas for two wells. The colors represent the time of analysis around the sands of interest: 8, 10 and 13. The top of the gas sands are enclosed by the ellipse.
The AVO analysis and classification was conducted in wells Kosni-1 and Kosni-101. The analysis mainly focused on two targets: one named Shallow Sand 27 (sands with an average porosity of 22%) and a deeper target named Sand 8 (Miocene sands of a platform edge with an average porosity of 18%). These sands have different gas saturations, with anomalies of Class 2 observed in CDPs, and bright spots observed in the stacked, migrated volume.

Figures 7, 8 and 9 show maps obtained for sands 8 and 27. These maps show the sands that are more likely to contain gas (in red) after being calibrated with the wells, through the seismic modeling (Figure 6), to reproduce the response observed in the real seismic data.
Figure 8 shows the map obtained with the product of the R0 and PR attributes rotated 45° (counterclockwise) so that the AVO anomalies are interpreted as Class 3 gas-bearing sands.

Sand with a red plot color is more likely to have gas while orange and pink coloring are most likely to be a sand with water (Figure 9).

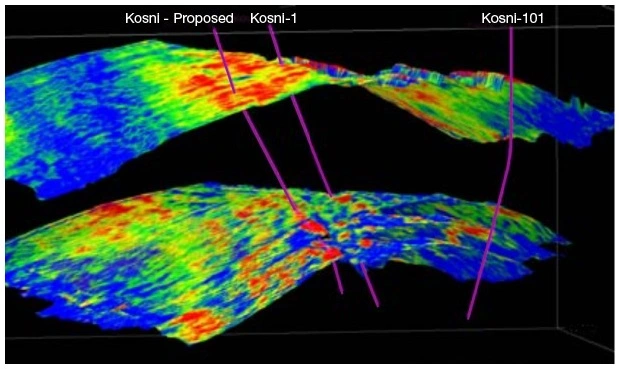
Figure 10 shows red plotted sands with gas, and yellow plotted sands with water. Trajectories of wells Kosni-1 and Kosni-101 and the path of the new location in the southwest of the well Kosni-1 are shown.
 rotated 45° for the horizons of sands
Application Summary
We have shown from the first example how small contrasts in acoustic impedance values and significantly lower Poisson’s ratios, along with far-offset stacks, can indicate gas-bearing horizons.
The second example provides an application of the techniques of AVO analysis based on linear fit to calculate attributes, which are used and interpreted through crossplot in prospecting for gas.
These are two real field examples of how attributes can be used to help locate economic, fluid-bearing reservoirs by visually locating these zones on seismic, and by helping develop targeted drilling plans.