Related Articles

Fracture Treatment Data Collection and Diagnostics
Hydraulic fracture models help predict how fracture stimulation treatment elements will affect the geometry of the created fracture. This allows one to design the most economic treatment for a given well and reservoir, and to make a post-treatment evaluation of whether the optimal design was achieved. In some cases, data collected during the job can be used to modify the treatment during the operation to better achieve objectives. In any case, the analysis provides information that can be used to adjust subsequent fracture treatments in the same well or nearby wells completed in the same producing formation.
Fracture diagnostic techniques are divided into several groups: direct far-field techniques, direct near-wellbore techniques, indirect techniques, and net pressure analysis.
Direct Far-Field Fracture Diagnostic Techniques
Direct far-field methods include tiltmeter-fracture-mapping and microseismic-fracture-mapping techniques. Both of these techniques use direct indications of a fracture’s physical presence to estimate its geometry. They require sophisticated instrumentation at the surface and in boreholes surrounding the well being fractured.
Tiltmeter-Fracture-Mapping
When a hydraulic fracture is created, the expansion of the fracture causes the earth around the fracture to deform very slightly. Extremely sensitive tiltmeters can be used to measure this microdeformation and the information can be used to calculate the approximate orientation and dimensions of the created fracture (Figure 1).
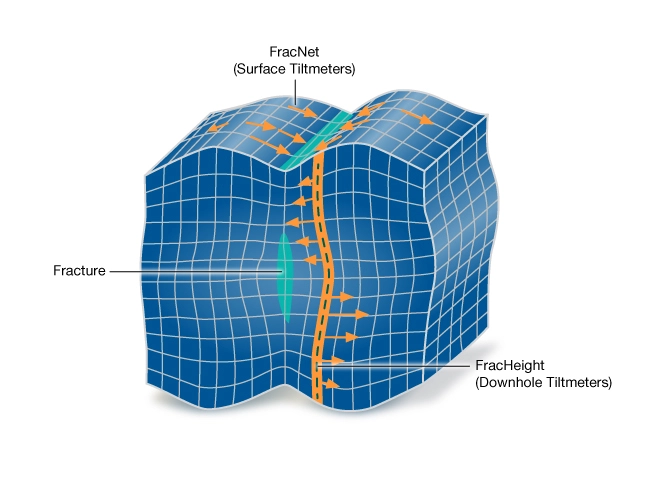
Surface tiltmeters, placed in shallow holes surrounding the well, are used to measure fracture-induced tilt at many points above a hydraulic fracture. The measurements are then used to calculate the fracture parameters that would produce such an observed deformation field. A typical hydraulic fracture at 7,000 feet depth will induce a surface tilt of only about 10 nanoradians (10 parts per billion). Downhole tiltmeters placed in vertical wells at depths near the treated zone can be employed to detect fracture height. However, microseismic fracture mapping is more commonly used for this purpose.
Microseismic-Fracture-Mapping
Microseismic-fracture-mapping relies on a downhole receiver array of accelerometers or geophones to detect and record the location of microseismic events or microearthquakes that are triggered by shear slippage in natural fractures surrounding the hydraulic fracture as it extends into the formation (Figure 2).
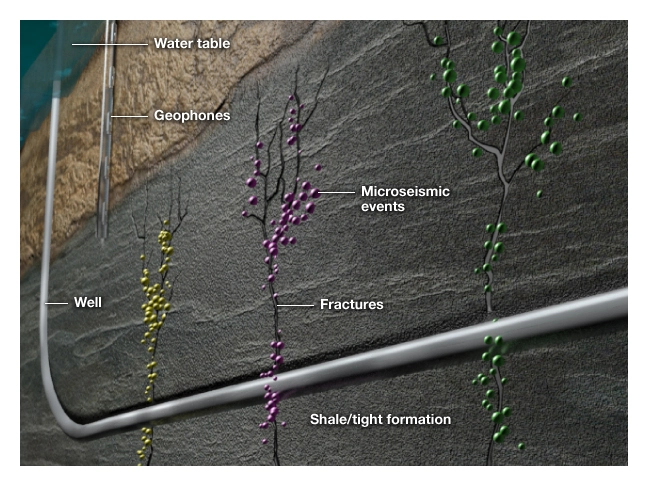
In essence, noise is created in a zone surrounding the hydraulic fracture. With sensitive arrays of these instruments, the noise can be monitored, recorded, analyzed, and mapped. While these tiny microseisms do not necessarily indicate the precise edges of the fracture itself, they do provide an indication of slippage effects resulting from the fracture.
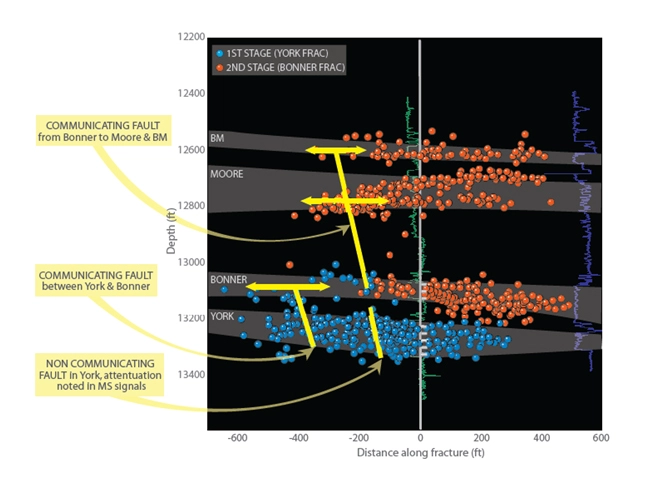
Microseismic fracture mapping can be used to “map” multiple fractures along horizontal wells as well as multiple fracture treatments in vertical wells (Figure 3).
Direct Near-wellbore Fracture Diagnostic Techniques
Direct near-wellbore hydraulic fracture diagnostics are run in the well that is being fractured. These methods employ logging tools to provide an indication or image of the portion of fracture that is very near the wellbore. Direct near-wellbore techniques include tracer logs, temperature logs, production logs, borehole image logs, downhole video, and caliper logs. If a hydraulic fracture intersects the wellbore, these direct near-wellbore techniques can be of some benefit in characterizing at least the height of the hydraulic fracture at the wellbore.
Tracer logs involve a radioactive tracer being added to the hydraulic fracture fluid so that a subsequent log can provide a positive indication of where the fluid has exited the wellbore and where it has concentrated. Production logs provide an indication of the relative contribution to flow of various portions of the perforated and fractured interval, a rough indication of the presence of a fracture and, perhaps, it’s upper and lower boundaries at the wellbore.
However, these near-wellbore techniques are not always definitive and cannot supply information about the extent (length), complexity, orientation or shape of the fracture, or even about the height of the fracture two to three wellbore diameters distant from the wellbore. In naturally fractured reservoirs, where multiple hydraulic fractures are likely to exist, the reliability of direct near-wellbore techniques is even more speculative.
Indirect Fracture Diagnostic Techniques
Indirect fracture techniques rely on mathematical models that relate how a created hydraulic fracture with a specific geometry might be expected to behave. By history-matching this behavior with a model, an indirect assessment of the likely fracture geometry can be inferred. Unfortunately, there are often multiple combinations of fracture length, width, height, complexity, and various geomechanical properties that demonstrate similar pressure and production behavior, making this approach approximate rather than definite. Indirect techniques include: post fracture pressure-transient-test and production data analyses, and modeling of net pressures during the fracturing treatment.
Because fracture-treatment data and the post-fracture pressure/production data are normally available on every well, these indirect fracture diagnostic techniques are the most widely used methods to approximate the geometry and dimensions of propped hydraulic fractures.
The fracture-treatment data can be analyzed with a pseudo-three-dimensional (P3D) fracture propagation model to determine the shape and dimensions of the created fracture. The P3D model is used to history-match the fracturing data, such as injection rates and injection pressures. Factors such as the in-situ stress and permeability in various layers of rock (i.e., productive formation, overlying and underlying beds), can be varied within expected ranges to achieve a history match of the field data.
Post-fracture production and pressure data can be analyzed using reservoir simulation models to arrive at an estimate of the dimensions of the created fracture. Key model inputs (such as values for formation permeability, fracture length, and fracture conductivity) are varied in the reservoir model to achieve a history match of the field data.
Again, the main limitation of these indirect techniques is that the solutions may not be unique unless there are good estimates for many of the key inputs beyond fracture dimensions. For example, if formation permeability is well defined from a well test prior to the fracture treatment, the value can be fixed in the model and the solution for the value of fracture length is more unique.
Limitations of Fracture Diagnostic Techniques
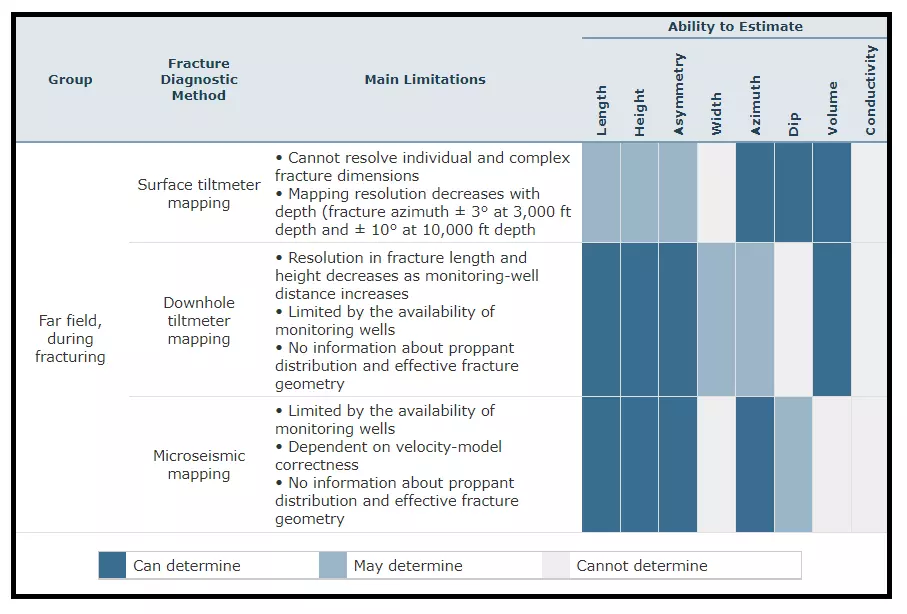
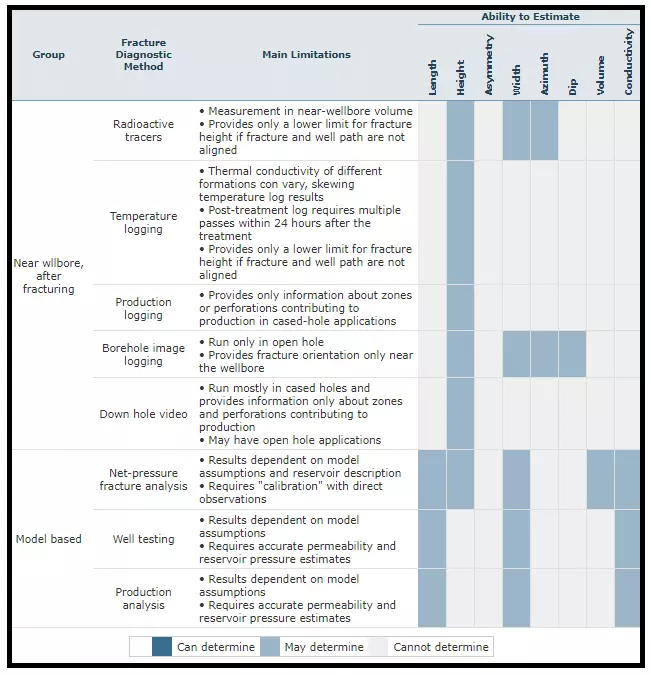
Table 1 and Table 2 (after Cipolla, et al., 2000) list hydraulic fracture diagnostic techniques and the limitations of their relative ability to quantify eight key fracture characteristics. These tables reveal several insights:
- Direct fracture diagnostic techniques such as tiltmeter mapping and microseismic monitoring provide the greatest amount of information.
- No individual technique can fully characterize a hydraulic fracture.
- Fracture conductivity still cannot be measured directly.
Fracture diagnostic techniques can provide important information, particularly when the well being analyzed is the first in a new play or field and where an operator’s experience is limited. However, fracture diagnostics can be expensive and time consuming, particularly for those examples that have the least number of limitations.
Net-pressure Analysis Fracture Diagnostic Technique
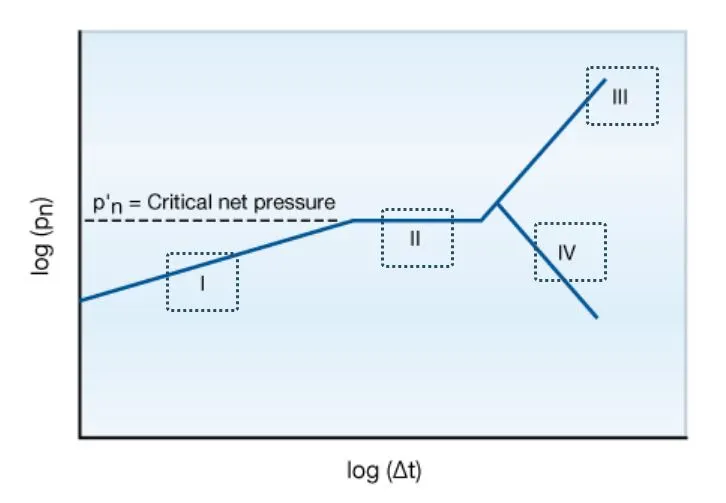
Net pressure is the pressure in the fracture minus the in-situ stress. Nolte and Smith (1981) showed how net-pressure behavior during or after a fracturing treatment can be used to estimate fracture growth patterns. Their method is based on the PKN fracture model, which assumes that as long as the fracture height is contained, the net pressure will increase with time. The time exponent is shown to be 1/5 for a minimal leakoff situation, but would be 1/8 for a high leakoff situation.
When Nolte and Smith analyzed bottomhole pressure data collected during fracture treatments, plotting the log of net pressure versus the log of elapsed pumping time, they found that the PKN theory held for certain situations, but that in some cases other fracture propagation modes were also observed (Figure 4).
How does one determine the “pressure in the fracture” to construct a net-pressure plot? Generally, the pressure during a fracturing job is directly measured at the surface (Figure 5). In certain cases, it may be possible to directly measure the bottomhole treating pressure (BHTP), the pressure inside the wellbore at the perforations. If not, the value for BHTP must be computed from the surface pressure by accounting for both frictional losses during pumping and the hydrostatic head of the fluid. These are functions of the well’s tubular configuration, well depth, and fluid properties such as density and viscosity. Accurate ongoing measurements of the density of the fracturing slurry (fluid plus additives and proppant) are an important aspect of fracture treatment monitoring. The use of crosslinked polymer fluids and high proppant concentrations (more than 4 pounds per gallon) can complicate the accuracy of computations of BHTP and sophisticated computer models are used to ensure the best possible estimates.
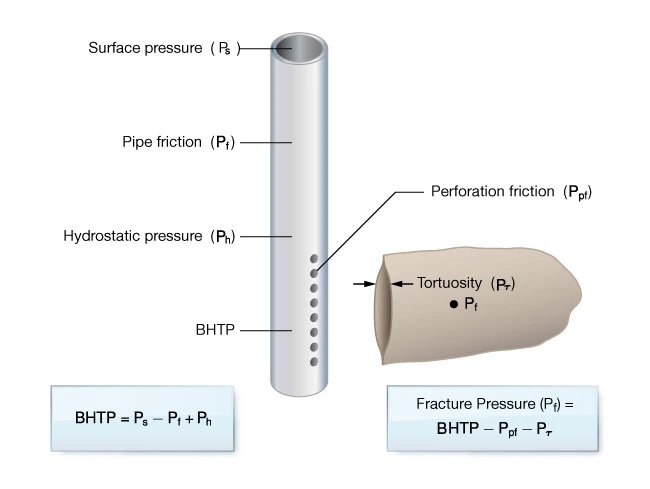
Once the BHTP is measured or computed successfully, the near-wellbore pressure drop due to perforation friction and tortuosity must be subtracted to determine the pressure in the fracture near the wellbore, the value that must be known and analyzed using either net pressure theory or fracture propagation models. However, both perforation friction pressure drop and any pressure drop due to fracture tortuosity can change during the treatment as the propping agent reaches the bottom hole. The proppant can erode perforations or plug some of the multiple fracture pathways that are the cause of tortuosity pressure drop. A step-down test run before the main fracture treatment can be used to estimate the near-wellbore pressure drop, but at the end of the treatment the pressure data need to be analyzed to determine if it changed during the treatment.