Related Articles

Fracture Initiation, Propagation and Closure Pressures
Fracture initiation, propagation and closure pressures are commonly expressed in terms of bottomhole pressure, with the depth referenced to the center of the perforations. These pressures may or may not be equal to one another.
Fracture initiation pressure also known as breakdown pressure or formation parting pressure may be expressed as follows:

Where
 fracture initiation pressure
 minimum horizontal stress
 maximum horizontal stress
 rock tensile strength
 pore pressure
 poroelasticity constant
The rock tensile strength,  , can be measured in the laboratory using a core sample. The other quantities that define the fracture initiation pressure are in situ properties. The actual value of
  may be affected by other factors such as the microstructure of the rock, borehole phenomena such as spalling and drilling induced fractures, perforation geometry and the properties of the fracturing fluid.
The main challenge in calculating a fracture initiation pressure is that the maximum horizontal stress is usually unknown. The above equation is therefore often used in a reverse manner to approximate the maximum stress from a known minimum stress and observed breakdown pressure.
Fracture propagation pressure is the stabilized value of the injection pressure during the period of time when the fracture is evolving. It is not an intrinsic formation property, because the fluid type, injection rate and leakoff characteristics affect its value.
Step-Rate Test
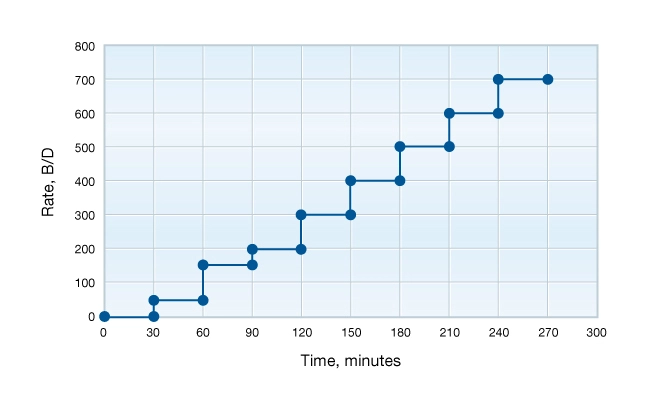
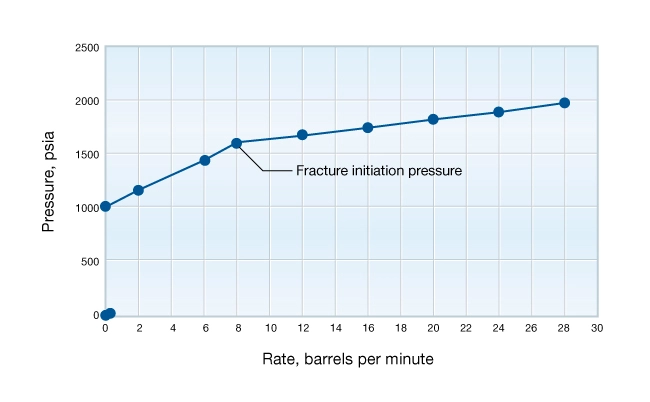
One way to determine fracture initiation and propagation pressures is through a step-rate test. This sort of test is often used to establish permissible injection pressures for waterfloods where it is important that the formation parting pressure not be exceeded during injection. In a step-rate test, fluid is injected into the formation while increasing the injection rate in discrete steps (Figure 1).
At each step, the stabilized pressure is recorded (Figure 2). The plot of stabilized injection pressures versus injection rates typically shows a point where the slope of the line changes. This point represents the fracture initiation pressure. Once this pressure is reached, the subsequent pressure increase with each injection rate step is much less than before the fracture was initiated.
Pre-Treatment Tests
Pre-fracture treatment tests are commonly used to determine in-situ stress and measure key pressure values. This data can then be used to plan or modify the design of fracturing treatments. These tests include in-situ stress tests and mini-fracs.
In-situ Stress Tests
In-situ stress tests are run primarily in new fields to gather data for designing and optimizing fracture treatments on subsequent wells.
An in-situ stress test can be either an injection-pressure falloff test or an injection-flowback test. These tests are conducted using small volumes of fluid (typically only a few barrels) injected at low injection rates (typically tens of gallons per minute or a few hundred barrels per day). The fluid is injected between packers into a short perforated interval (perhaps 1 to 2 ft) to minimize the masking effect that can occur from compressing the fluid in the wellbore.
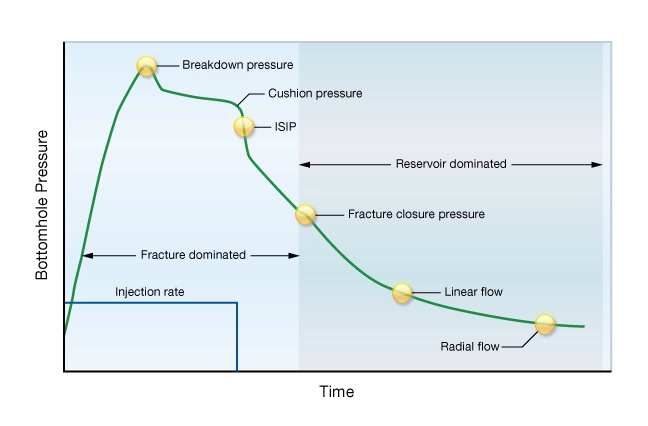
Typically, water or nitrogen is pumped at a rate just sufficient to initiate a small fracture. When this occurs, the pumps are shut down, and the pressure response is recorded and observed to determine the bottomhole fracture closure pressure. This fracture-closure pressure is representative of the in-situ minimum horizontal stress. When the pressure in the created fracture is greater than the fracture-closure pressure, the fracture is open. When the pressure in the created fracture is less than the fracture-closure pressure, the fracture is closed.
The bottomhole value of the pressure at the moment of fracture closure is determined by careful examination of the pressure fall-off curve (Figure 3). The basis for selecting the fracture closure point is that before closure, the process of fluid leakoff along the fracture and the elastic behavior of the formation dominate the pressure falloff behavior, but after closure the pressure is governed by the laws of fluid flow in porous media. A simple pressure versus time plot or pressure versus square root of time plot can be used to pick the closure pressure.
Mini-fracs
On most wells, mini-fracture tests or “mini-fracs” are pumped ahead of the main fracture treatment to obtain data that are used to confirm predictions made in the job design and to adjust the design as needed.
Mini-fracs are run with fluid similar to the fracture fluid used in the main treatment, but without proppant. Several hundred barrels of fracturing fluid are pumped at fracturing rates high enough to create a fracture of similar height to the one expected to be created during the main fracture treatment. After the fracture has been created, the pumps are shut down, and the pressure decline is monitored. The pressure decline can be used to estimate the fracture-closure pressure (as in the case of an in-situ stress test) as well as:
- Instantaneous shut-in pressure (ISIP)
- Fracture gradient
- Net fracture pressure (the additional pressure within the fracture above the pressure required to keep the fracture open)
- Fluid efficiency (the ratio of the stored volume within the fracture to the total fluid injected)
- Total fluid leakoff coefficient
- Formation permeability
- Reservoir pressure
For any injection-falloff test to be successful, the connection between the wellbore and the created fracture must be well defined. If there is poor connectivity, interpretation of the data can be difficult. Injection tests in naturally fractured formations can result in multiple fractures that follow tortuous pathways rather than a single vertical fracture plane. In this situation the pressure drop in the “near-wellbore” region can be very high. One way to determine the cause of a high near-wellbore pressure drop is via a “step-down” test pumped just before a mini-frac.
The bottomhole pressure during injection into a hydraulic fracture is a function of the net pressure in the fracture and the near-wellbore pressure drop. To measure the near-wellbore pressure drop, the net pressure in the fracture needs to be relatively constant. To do this, a step-down test is started by injecting into the well for 10 to 15 minutes, after which, in most cases, the net pressure is relatively stable. The injection rate is then reduced in three to five steps to a rate of zero; at each step the rate is held constant for approximately one minute so the stabilized injection pressure can be measured. The objective of the test is to measure the near-wellbore pressure drop as a function of injection rate. If the net pressure in the fracture is relatively stable, then the change in bottomhole injection pressure as the injection rate is reduced will be a function of the near-wellbore pressure drop.
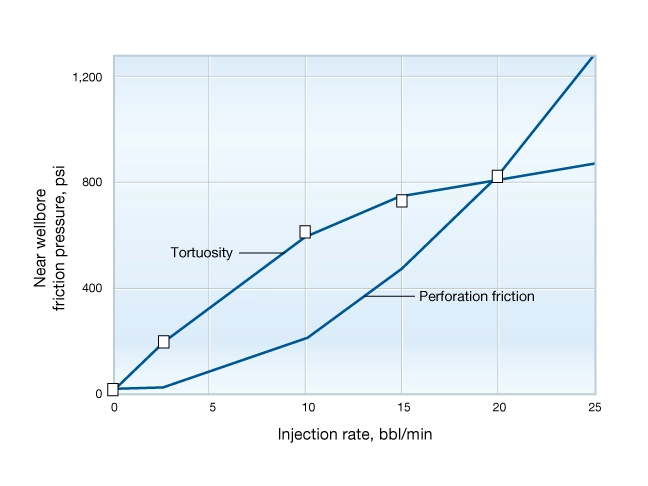
Subsequent analysis of step-down test data permits the analyst to distinguish which of the two main causes of near-wellbore pressure drop are present. When the pressure drop near the wellbore is caused by perforation friction, the near-wellbore pressure drop (ΔP) will be a function of the injection rate (q) squared.

If the near-wellbore pressure drop is caused by tortuosity, then the near-wellbore pressure drop will be a function of the injection rate raised to a power of one-half.

Figure 4 illustrates these effects.
Computing the value of in-situ stress and near-wellbore pressure drop due to tortuosity or perforation friction permits computation of the net pressure in the fracture the difference between the actual pressure in the fracture and the minimum in-situ stress.
The net pressure profile (Figure 5) is determined by both tip effects and the pressure drop down the fracture caused by viscous fluid flow. In many formations, the pressure drop in the fracture is dominated by the pressure increases near the tip of the fracture as propagation occurs. The net pressure profile controls both the fracture height and fracture width distribution along the fracture length.
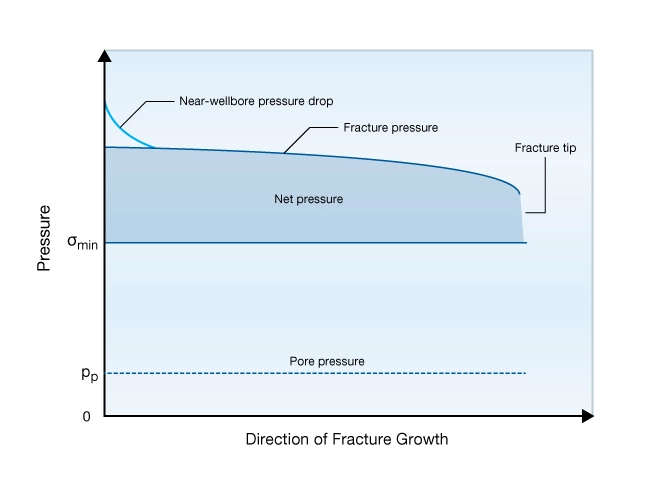
Knowing the net pressure enables the engineer to design the main fracture treatment, perform onsite analyses of the fracturing pressures and perform post-fracture analyses of the fracturing pressures.