Injection Well Profiling Using Radioactive Tracers
Although many of the methods available for radioactive tracer logging can be made quantitative, two basic techniques are most often used. These are referred to as the velocity shot technique and the area under the curve technique. It is common for results from either of these techniques to be presented in the form of a flow or injection profile on the tail of the log.
In the velocity shot technique, the tool is held stationary and a small cloud of radioactive material is ejected into the flow. As this cloud passes two gamma ray detectors on the tool below the ejector, a measurement is made of the time of transit between those detectors. This measurement is made by recording the response at the detectors while the film is scrolling at a constant rate; i.e., the recorder is on time drive. Figure 1 illustrates this technique.

In this figure, a velocity measurement is being made between the upper and lower set of perforations. By performing a number of tests at various points in the wellbore, a flow profile as shown on the right may be produced. The differences between the constant values measured between, above, and below the perforations represent the loss of fluid to the formation in this injection well.
The volumetric flow rate may be computed using the following equation:
![]()
or, in SI units,
![]()
where:
Q= flow rate, B/D (Q′ is in m3/D)
F= flow profile correction factor, typically less than 1.0
DS= distance between detectors, ft (DS′ is in meters)
D= pipe internal diameter (ID), in. (D′ is in centimeters)
d= tool diameter, in. (d′ is in centimeters)
t= time between detections, seconds
The profile-correcting factor (F) may be computed to match surface and downhole injection rates above the top perforations. Once the term in the right-hand brackets is computed, and assuming that F is constant, the term does not change and only 1/t need be calculated thereafter. If fraction or percent of flow only is to be calculated, then the flow varies directly with 1/t.
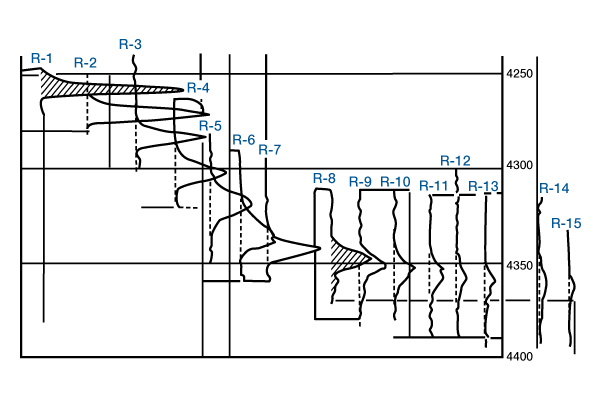
In the area under the curve technique, it is assumed that the area is directly related to the amount of radioactive material ejected by the tool into the flow. As the initial area is reduced, the fluid remaining is reduced proportionally. Figure 2 shows a series of passes with a gamma ray after a large cloud of radioactive material has been ejected above the interval to be evaluated.

The initial run, designated R-1, is at the far left. To determine the amount remaining at the location of the cloud in run eight (R-8), the areas under R-1 and R-8 must be measured and
![]()
![]() (1)
(1)
The difference between the flow remaining at two successive runs is the fraction of the flow lost to the formation between those runs. Computation of the fraction of flow remaining at each run may then be used to determine an injection profile across the interval.
Of the two techniques presented in this section, the velocity shot technique is better for quantitative answers, although the area technique often agrees quite well with it.
In some international locations, radioactive tracers are difficult to obtain. This situation has led to the evolution of non-radioactive tracers having high-capture cross sections, and the application of systems such as Schlumberger’s “Flagship Tool String,” which employs RST measurements.
 Petro Shine The Place for Oil and Gas Professionals.


