Observations on Stress in Sedimentary Rocks
This section reviews geologic factors that are correlated with variations of horizontal stress magnitude measured in sedimentary basins. When modeling stress, it helps to know:
- How much could the magnitude of
 vary within a particular basin?
 - Which variables in the stress model are required to match observed stress variations?
- Which variables have the greatest impact on stress prediction?
A review of stress measurements made in sedimentary basins worldwide has demonstrated that pore pressure, lithology, tectonic setting, and diagenesis are the main factors that govern variations of ![]() . Information about the magnitude and variability of
. Information about the magnitude and variability of ![]() is much more limited for reasons described in the section on Borehole Measurements.
is much more limited for reasons described in the section on Borehole Measurements.
Factors Affecting the Least Horizontal Stress
Field measurements show that the least horizontal stress is primarily dependent on pore pressure, lithology and diagenesis. It is observed that ![]() :
:
- Increases with increasing depth and pore pressure, except where production causes local anomalies
- Varies systematically with lithology and with clay content
- Tends to decrease as the degree of consolidation increases
- Is less than lithostatic pressure in most shale
- May be lower in shale than in adjacent sandstone
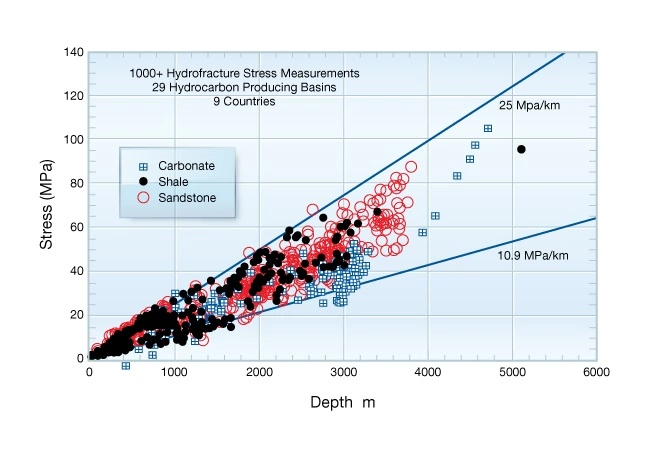
Figure 1 gives a global overview of hydraulic fracture stress measurements made in sedimentary rocks. As expected from theory, most measurements plot between hydrostatic and lithostatic pressure. Measurements plotting below the hydrostat are from depleted reservoirs; those plotting above the lithostat are from regions where the lithostatic stress is greater than 25 MPa/km, or from the anomalous stress region in the upper 1000 km. Notice that no systematic lithology dependence can be seen in this global overview.
A systematic dependence of ![]() on lithology, diagenesis, and basin setting can be seen when measurements from a single basin are averaged and compared to different basins. Figure 2 is a multi-basin comparison of stress ratio
on lithology, diagenesis, and basin setting can be seen when measurements from a single basin are averaged and compared to different basins. Figure 2 is a multi-basin comparison of stress ratio ![]() vs. overburden stress
vs. overburden stress ![]() , normalized by depth z, where:
, normalized by depth z, where:
![]()
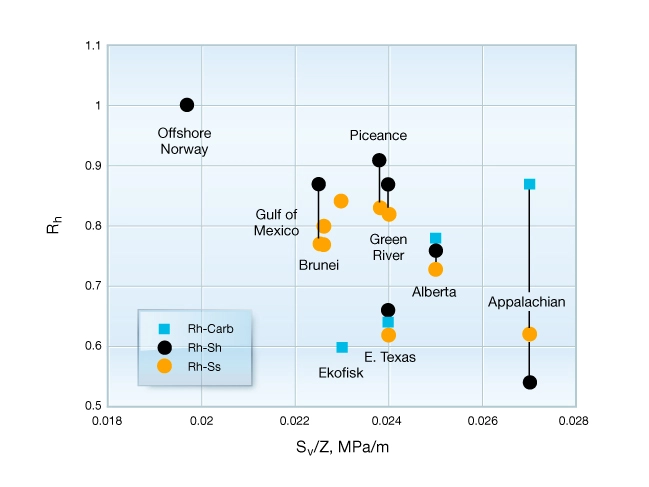
As is often assumed, ![]() in shale tends to be greater than
in shale tends to be greater than ![]() in sandstone or limestone in most basins. The Appalachian basin is an exception where horizontal strain is responsible for the higher stress in elastically stiffer limestones and sandstones. The anomalous stress in Appalachian shale means that stress measurements should be targeted to both reservoir rocks and bounding shale formations. Otherwise, this anomalous stress profile will not be detected by geophysical measurements or represented by simple reference models.
in sandstone or limestone in most basins. The Appalachian basin is an exception where horizontal strain is responsible for the higher stress in elastically stiffer limestones and sandstones. The anomalous stress in Appalachian shale means that stress measurements should be targeted to both reservoir rocks and bounding shale formations. Otherwise, this anomalous stress profile will not be detected by geophysical measurements or represented by simple reference models.
The influence of diagenesis is shown by a decreasing ![]() with increasing
with increasing ![]() observed in North American basins. Inter-basin variations in
observed in North American basins. Inter-basin variations in ![]() indicate that diagenesis plays a role in the average stress in a basin. The existence of systematic inter-basin variations in
indicate that diagenesis plays a role in the average stress in a basin. The existence of systematic inter-basin variations in ![]() is one good reason stress models must be calibrated.
is one good reason stress models must be calibrated.
The dependence of ![]() on initial pore pressure can be seen by comparing the average stress in the over-pressured Piceance basin with the normally-pressured data reported for the Gulf of Mexico, Brunei, and Venezuela.
on initial pore pressure can be seen by comparing the average stress in the over-pressured Piceance basin with the normally-pressured data reported for the Gulf of Mexico, Brunei, and Venezuela.
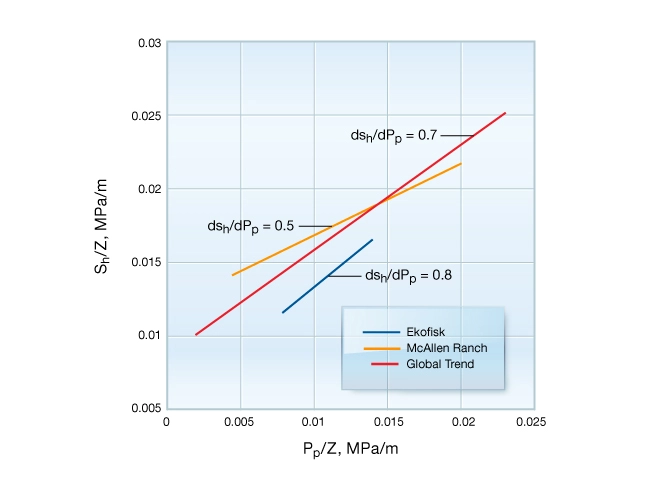
 to pore pressure
| Location | Number of Measurements | Lithology | |
|---|---|---|---|
| Ekofisk Field, North Sea | 31 | Ekofisk chalk | 0.8 |
| McAllen Ranch, South Texas | 19 | Vicksburg sandstone | 0.5 |
Observed variations of stress with changing pore pressure are consistent with poroelastic theory. For a tectonically relaxed basin, under uniaxial strain boundary conditions, the horizontal stress can be written:
![]()
where ![]() is the Biot poroelastic constant.
is the Biot poroelastic constant.
![]()
For ![]() = 1,
= 1, ![]() ranges from 0.33, for
ranges from 0.33, for ![]() = 0.4, to 0.88 for
= 0.4, to 0.88 for ![]() = 0.1. However, in regions of active thrust faulting horizontal stress is predicted to decrease with increasing pore pressure.
= 0.1. However, in regions of active thrust faulting horizontal stress is predicted to decrease with increasing pore pressure.
Observations on the Maximum Horizontal Stress
Published estimates of the maximum horizontal stress magnitude are limited. In the early 1980s, it was often assumed that in offshore basins like the Gulf of Mexico and the North Sea, ![]() . This assumption was plausible for weak compacting sediments in tectonically inactive settings, but not in general, as noted by Hubbert and Willis (1957).
. This assumption was plausible for weak compacting sediments in tectonically inactive settings, but not in general, as noted by Hubbert and Willis (1957).
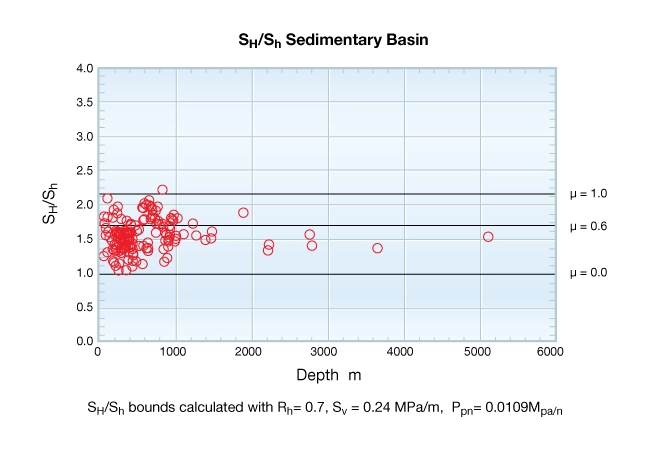
Figure 4 shows the ratio of ![]() to
to ![]() computed from openhole hydraulic fracture stress measurements made in North American basins. At these locations, horizontal stresses are not equal. The ratio of total stresses is generally less than 2.0 with an average value of 1.5:1. As discussed before, such estimates of
computed from openhole hydraulic fracture stress measurements made in North American basins. At these locations, horizontal stresses are not equal. The ratio of total stresses is generally less than 2.0 with an average value of 1.5:1. As discussed before, such estimates of ![]() are likely to be overestimates. To put this average ratio into perspective, if
are likely to be overestimates. To put this average ratio into perspective, if ![]() 0.75 psi/ft, then
0.75 psi/ft, then ![]() 1.12 psi/ft or slightly greater than
1.12 psi/ft or slightly greater than ![]() . This state of stress is borderline between the strike-slip and the normal faulting regimes.
. This state of stress is borderline between the strike-slip and the normal faulting regimes.
 to
to  from open hole measurements
 Petro Shine The Place for Oil and Gas Professionals.
