Non-Clay Contributors to Low Resistivity
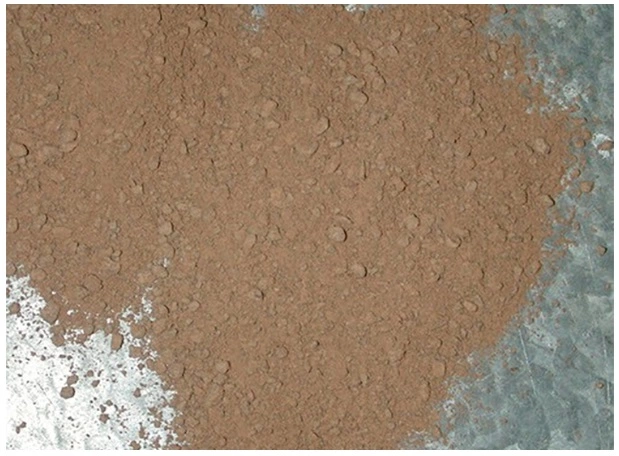
While clay (Figure 1) is often a major element of low resistivity pays, there are other minerals and geological situations that can contribute to the low resistivity pay phenomenon. Though not a common occurrence, it is important to be able to identify these factors and recognize the ways in which they might affect well log resistivity readings.
Conductive Minerals
In some conventional hydrocarbon reservoirs where the actual water saturations proved to be lower than those initially calculated by petrophysical log analysis, conductive minerals were sometimes the cause of the low resistivity readings.
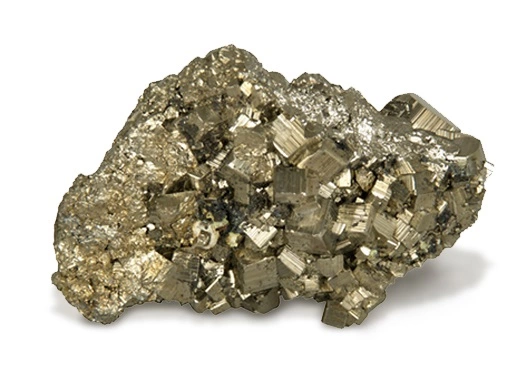
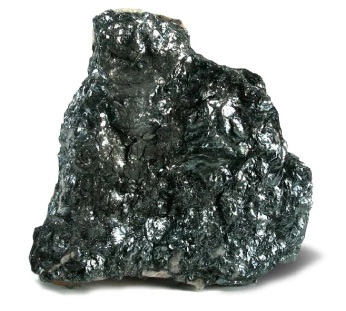
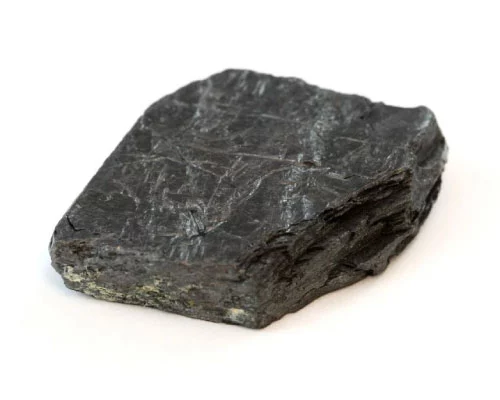
Pyrite (Figure 2), a common heavy mineral sometimes found in marine sedimentary rocks, is a good electrical conductor as are some other minerals, such as hematite (Figure 3) and graphite (Figure 4).
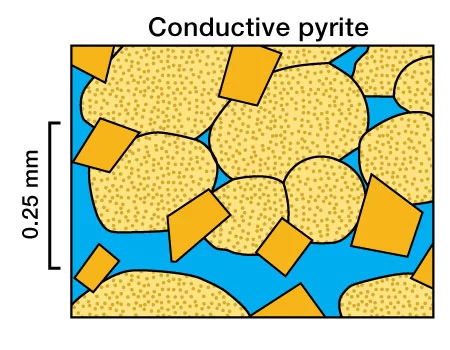
Sandstones containing as little as 5-7% of such disseminated conductive minerals can cause low logging while drilling (LWD) and wireline log resistivity readings. Pyrite has been found to form a continuous electrical network at low mineral concentrations and exhibits electrical conductivity that can be greater than the formation water conductivity. Al-Awad, Hamada and Almalik (2001) noted that pyrite resistivity can range from 0.03 to 0.8 ohm-m. Pyrite’s conductivity is metallic and, consequently, any transfer of current between the water and pyrites is based on a conversion from ionic to electronic conduction, and vice versa. This leads to polarization at the water-pyrite interfaces, with corresponding frequency-dependent electrical properties. Consequently, the electrical properties of porous rocks containing pyrite will depend on the amount of disseminated pyrite (Figure 5), its distribution inside the rock, and the frequency of the electric current measurement.
While this type of low resistivity pay is not often encountered, conductive minerals are capable, in certain circumstances, of exerting an even greater influence on well log readings than clay and shale.
Sandstones Derived from Igneous or Metamorphic Rock
In some oil and gas fields, productive intervals have been developed in granite washes and in fine-grained sandstones consisting of a significant amount of igneous or metamorphic rock fragments. These geological formations should not be classified as igneous; they are deposited as the erosional products of volcanic, plutonic, and neighboring country rock (the formation rocks around igneous activity) (Figure 6).
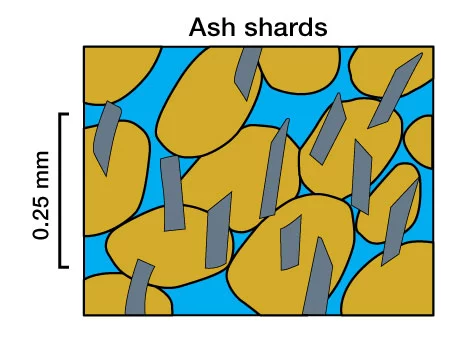
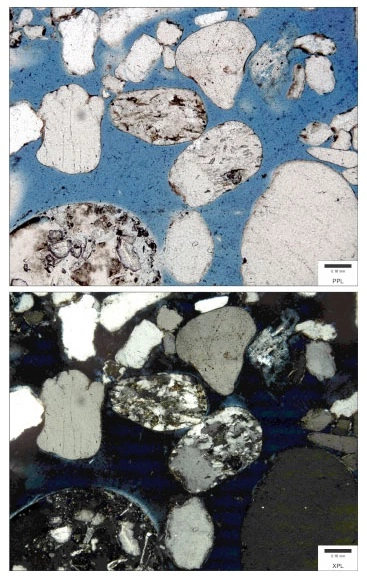
According to Darling and Sneider (1993), these intervals exhibit highly variable mineralogy. They usually have a very high percentage of feldspars, igneous and metamorphic rock fragments, and quartz, but may be low in clay mineral content. The fine-grained sandstones, when combined with the alteration of volcanic lithics and lithic fragments (Figure 7) and variable mineralogy, produce high gamma ray readings, low resistivities, and little or no spontaneous potential development. This type of log response can easily be misinterpreted as shale.
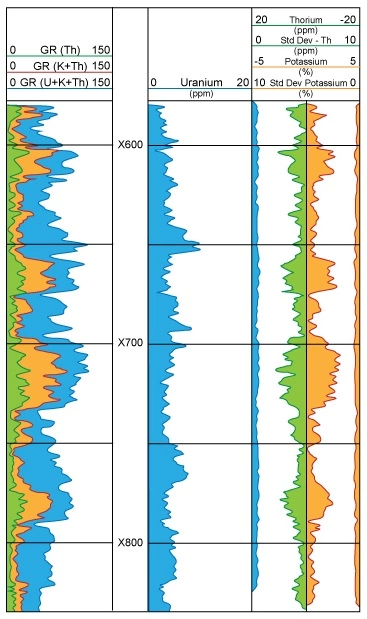
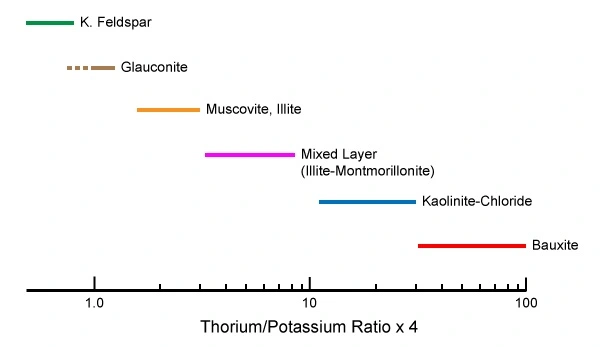
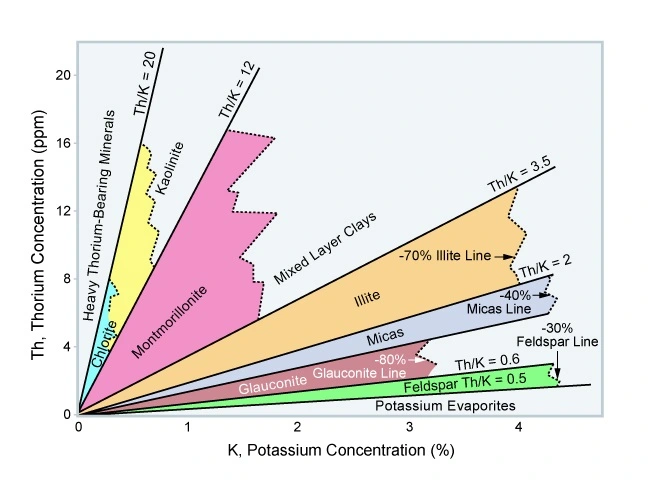
These low resistivity pay intervals can vary in thickness from millimeters to tens of meters. Natural gamma ray spectroscopy logs and their various interpretation techniques should be used to identify such intervals (Figures 8 through 12).
Interpretation Techniques for Sandstones Derived from Igneous or Metamorphic Rocks
Figure 8 displays the different energy levels of the potassium, uranium, and thorium contributions to the gamma ray spectrum, together with the five windows used by Schlumberger to capture these contributions with the Spectralog logging tool.
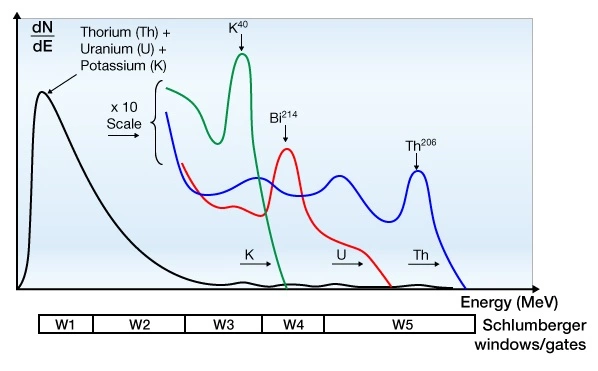
Figure 9 is a commonly used display to highlight the incremental contributions of potassium, uranium, and thorium to the total gamma ray readings.
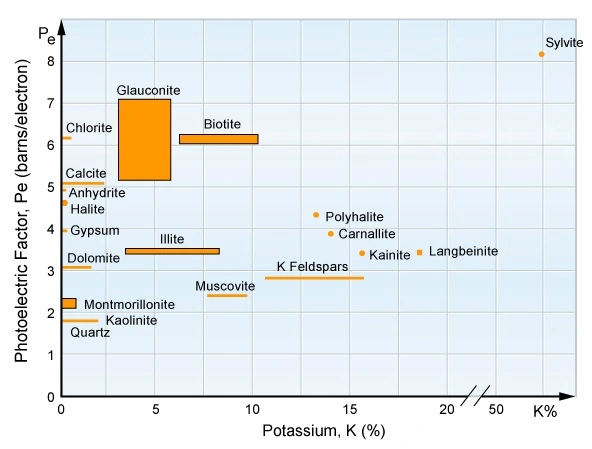
Calculating the thorium/potassium ratio has been found to be an effective technique to distinguish between the various clay and other minerals as there is almost no overlap in their thorium/potassium ratios (Figure 10).
Crossplotting the thorium and potassium components enables a visual separation display of clay minerals, micas, feldspars and evaporites (Figure 11 and Figure 12).
 Petro Shine The Place for Oil and Gas Professionals.


