Related Articles


Learning Objectives
After completing this topic “Low Resistivity and Low Contrast Pay“, you will be able to:
- Summarize the causes of historical limitations of low resistivity and low contrast pay interpretation.
- Be conversant with the advances in well logging tools and interpretation.
- Categorize the mineralogical causes of low resistivity and low contrast pays.
- Determine the effect of grain size on the irreducible water saturation.
Introduction to Low Resistivity and Low Contrast Pay Interpretation
It is frequently claimed that, even using the latest technologies and interpretation techniques, most of the easier to find and easier to bring onto production petroleum plays have already been exploited. However, a number of plays that were uneconomical to explore and produce just a few years ago are now the targets of ambitious drilling programs. The unconventional resources plays are good examples of these (Figure 1).

This topic addresses low resistivity and low contrast pay interpretation in conventional reservoirs and provides an overview of the geological setting of low resistivity pay formations, common logging tool limitations, traditional log evaluation methods, and newer tools used to interpret such low resistivity pay zones.
Low resistivity and low contrast pay zones are hydrocarbon-bearing reservoirs with low resistivity or low contrast in resistivity log responses due to the influence of a variety of factors associated with mineralogy, water salinity, and microporosity, as well as bed thickness, dip, and anisotropy.
Low resistivity pays are characterized as having resistivities ranging from 0.5 to 5 ohm-m. Low contrast pay zones have little, or sometimes no, contrast between the hydrocarbon-bearing and the water-bearing or shale zones. This type of petrophysical interpretation problem is most commonly seen when the resistivity logging tool encounters a zone that contains fresh formation water with low salinity. As the salinity decreases, the electrical pathway through a body of water becomes weaker and more dispersed, thus causing the water to become more resistive. Therefore, while the resistivity of the pay zone may not be especially low, the resistivity of the water zone is high enough to make it difficult to distinguish between pay and water-bearing zones.
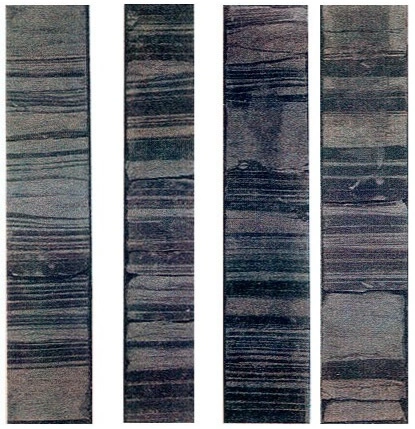
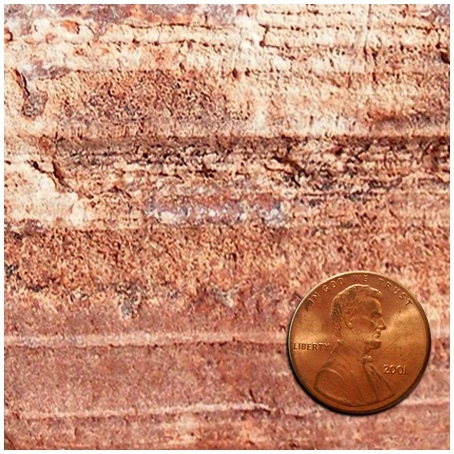
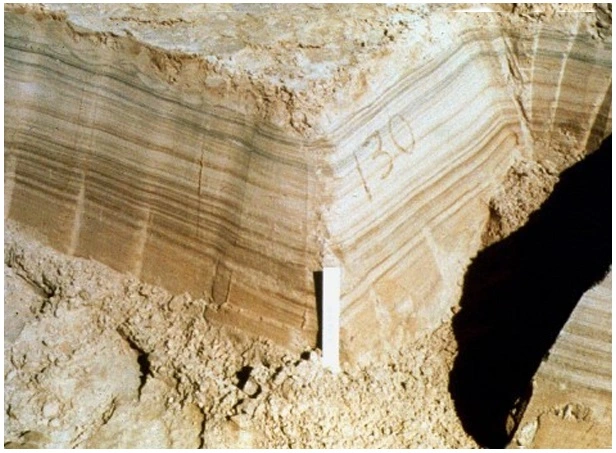
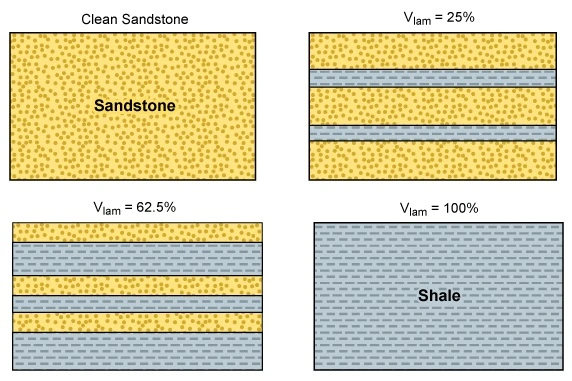
It has been suggested that up to 30% of the world’s estimated hydrocarbon reserves are contained in laminated, low resistivity, low contrast, shaly sandstone formations that are often either overlooked or are evaluated as being unproductive (Figures 2 through 6).
Laminated, Low Resistivity, Low Contrast, Shaly Sandstone Formations
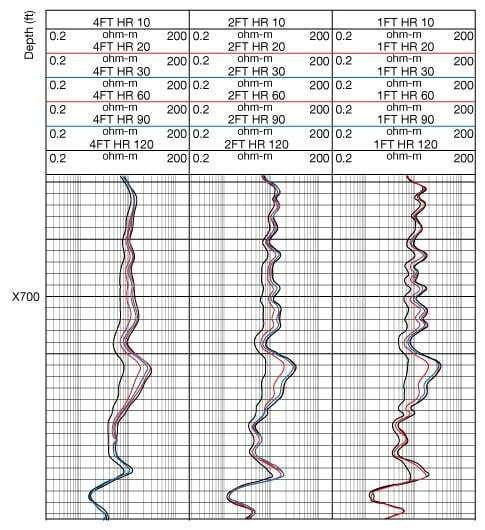
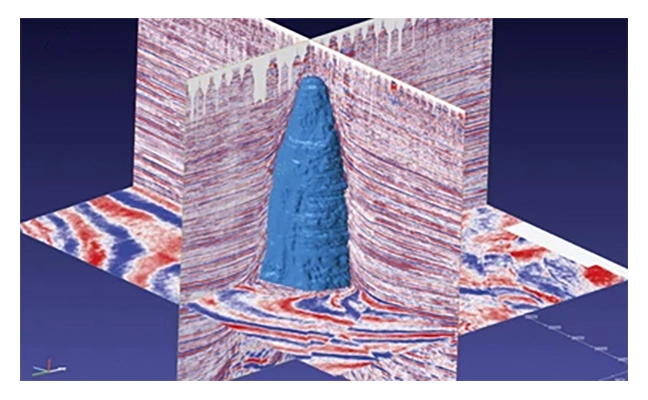
It has been asserted that, in all probability, many potentially prolific producers have already been plugged and abandoned, owing to a lack of adequate formation evaluation. In the early days of log analysis, it was a common practice to regard water saturations above 50% as being always non-commercial. However, with advances in both well logging tools and their logs (Figure 7) and, to a much smaller extent, 3D seismic technology and techniques (Figure 8) came the realization that some of those supposedly non-commercial zones were, in fact, productive pays.
A number of low resistivity reservoirs that have sometimes proven to have good hydrocarbon production characteristics, should be reevaluated. In their statistical analysis of low resistivity wells throughout the Gulf of Mexico, Shelton and Hill (in Moore, 1993) observed that such well completions produced 43% more reserves than the average oil well in the Gulf, while gas production from such wells was statistically on par with that of typical gas wells.
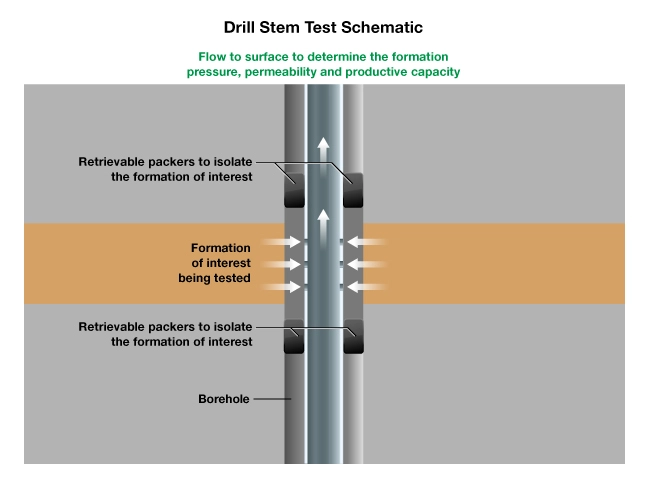
As more technical papers and articles addressed this phenomenon, the problem came to be recognized in basins all around the world, and more companies conducted drill stem testing (DST) (Figure 9 and Figure 10) and set production casing on low resistivity wells. A drill stem test is a procedure for isolating and testing the pressure, permeability and productive capacity of a geological formation during the drilling of a well. The test is an important measurement of pressure behavior at the drill stem and is a valuable way of obtaining information on the formation fluid and establishing whether a well has found a commercial hydrocarbon reservoir.
Log data that was once used to summarily condemn a well as being non-commercial is now used by log analysts to ascertain the various effects of lithology, mineralogy, grain size, porosity, and irreducible water saturation opening new fields to commercial hydrocarbon production. Sometimes, this is a case of re-interpreting the original well log data more skillfully; in other cases, improved log data is acquired by higher technology tools.
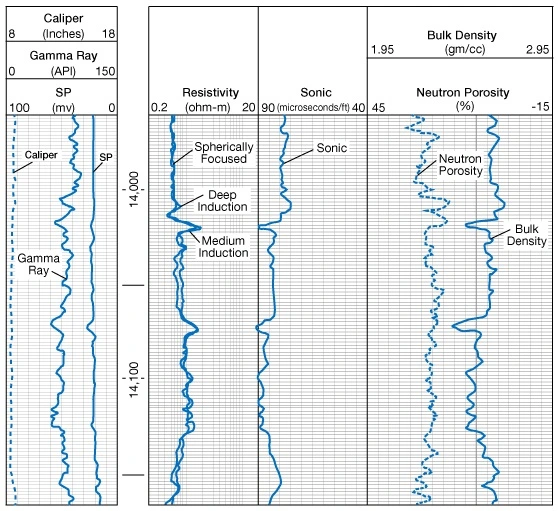
Petrophysicists now know that a combination of the mineralogy, bed thickness, grain size or water salinity causes anomalously low resistivity responses. Low resistivity pay intervals can sometimes be found in geological formations where deep resistivity tools read from 0.5 to 5 ohm-m resistivity. Figure 11 is such an example, where the low resistivity zone between 14,017 feet and 14,128 feet was completed and tested at 1,564 bbl/d of oil, 1.6 MMCFD of gas, and 27 bbl/d of water.

