Related Articles


Day 6
By day 6, the apparent formation dip began to steepen, as shown by the curve at the top of the log in Figure 10.

In this figure, we also see that the purple wellbore projection had to be tilted more to accommodate this dip change. It was therefore decided to issue a target change.
Notice also, in Figure 11 that on the TSP log that the magenta TSP-MD curve (stratigraphic wellbore path) undulates back upward as the wellbore path moves away from the bottom of the target zone.
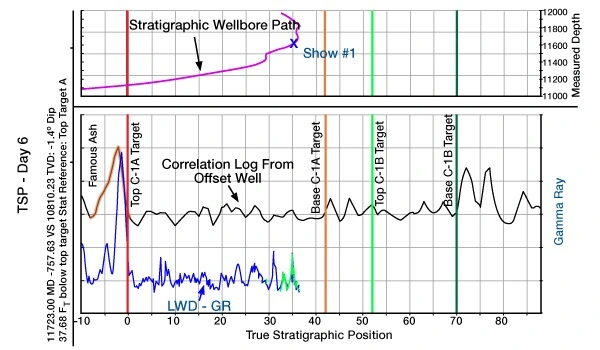
Now look at the TSP-GR curve. In response to this undulation, we observe that the green curve re-traces over the blue curve.
Day 7
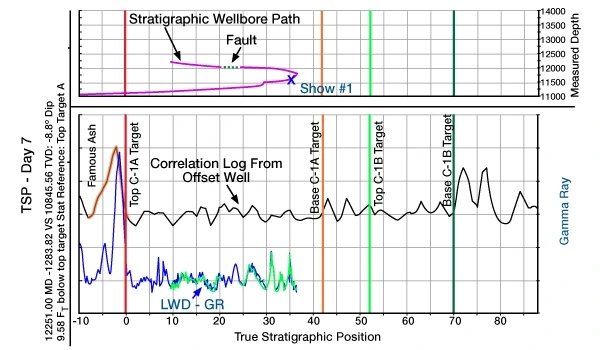
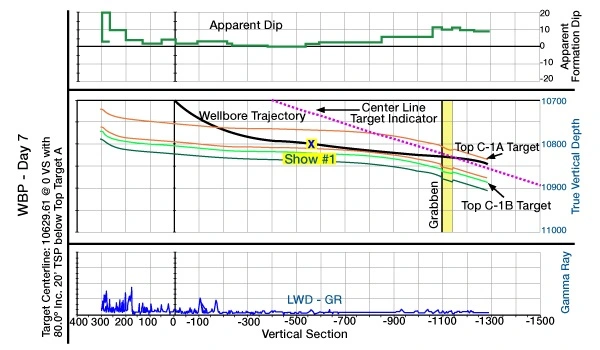
The apparent formation dip increased to 10 degrees (Figure 12), and the well crossed a small graben, as seen in Figure13. This required another target change to keep the well in target. Several fractures were cut as the day progressed.
Day 8
The well barely missed drilling out the top of target on day 8, coming within two feet of the ash, as seen by the sharp gamma ray peak above the top of the “C1a” Target in Figure 14.
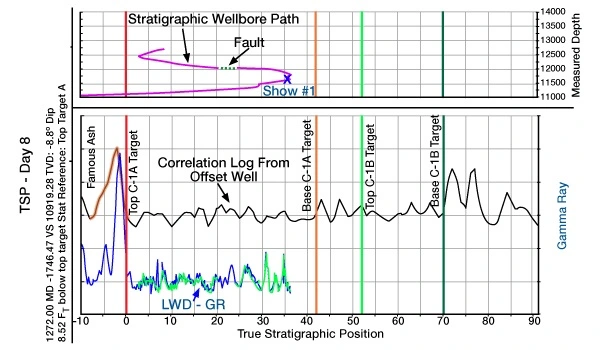
Even though a fracture system was cut in this interval the mudlog indicated little flow into the wellbore. The rock just below the ash is much softer than that seen lower in the target. As the wellbore approached the ash at a low angle, the flare stopped even though fractures were seen. This emphasizes the importance of drilling a horizontal well in the best stratigraphic position. The dip continued at 10 degrees, so no target change was necessary, as seen in Figure 15.

With the close proximity of the ash, the decision was made to change the bottom hole assembly to put a more aggressive angle on the motor.
Day 9
Seismic data indicated that a large “down-to-the-south” normal fault should be expected when the wellbore reached out 2700 feet (Vertical Section). It was thus decided to begin setting up the well to encounter the fault, with an inclination that would allow the wellbore to traverse down through the section and land in the “B” target. Even though the apparent formation dip was flattening throughout the day (Figure 16), the target line was not changed.

This caused the well to traverse down-section as planned, shown in Figure 17.
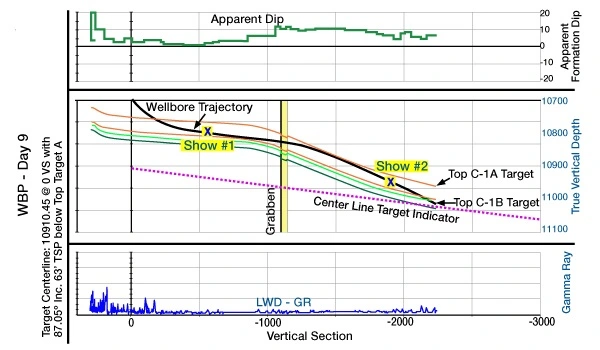
A significant fracture system was later cut between 12760 -12840 feet, with the returns flowing 20% oil in the mud. Late in the day, as the well neared the “C1b” zone, a target change was ordered to enable the well to land smoothly in the zone.
Day 10
The well was landed on the new target, and cut fractures throughout the day (Figure 18).

The well flowed back oil and gas most of the day. At one point, oil comprised 32% of the returns. The Apparent dip had flattened to 1.8 degrees, so the target was fine-tuned to ensure that the well stayed within the thin “C1b” zone (Figure 19).
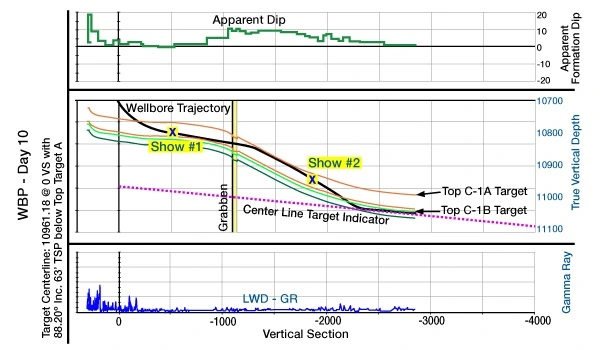
The fault (anticipated at 2700 feet Vertical Section) was expected to be cut this day.
Day 11
The Apparent dip flattened a little through the day, as indicated in Figure 20.

A fine adjustment of the target was made to accommodate this flattening. Fractures were cut between 14000 -14220 feet, with 34% oil in the returns (Figure 21).

Still no fault was cut, and the well had reached out to a Vertical Section of 3,220 feet.
Day 12
The dip did not change through the day (Figure 22).
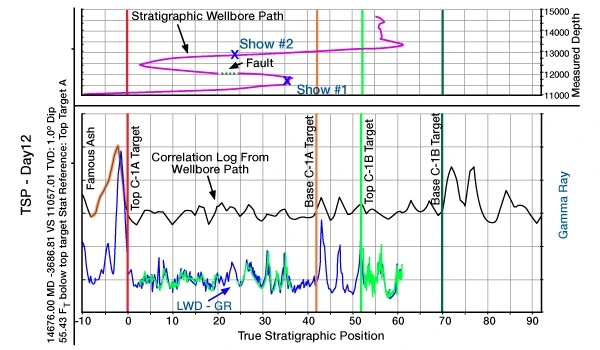
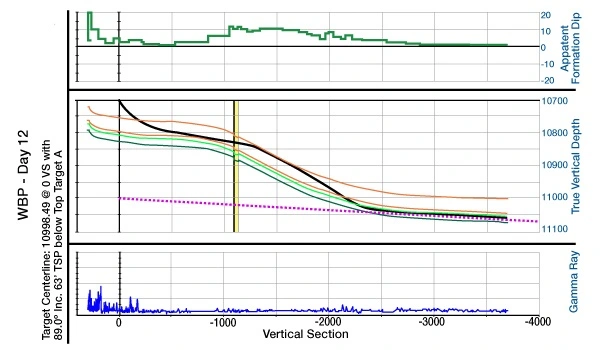
The well did not cut many new fractures during the day until it reached a measured depth of 14580 feet. It was thought that this might be the expected fault and so the gamma correlation was watched closely (Figure 23).
However, no fault could be correlated.
Day 13
The last day started with a great show, encountered between 14660 to 14760 feet, measured depth. The Geosteering Team was certain that this show was associated with the much-anticipated fault (Figure 24).

This interpretation placed the fault at a Vertical Section of 3950 feet (fully 1000 feet beyond the expected location), as seen in Figure 25.

The well lost returns for a short while as the bit cut through the fracture. The well then began to flow with 1000 pounds of Casing Pressure, a 30-foot flare, and a significant volume of oil in the returns.
A good bit of ash was seen in the samples, which confirmed for the Geosteering Team that a fault had been cut since the borehole had been quite some stratigraphic distance from any ash. It was very apparent that this was not the “Famous ash” because the gamma was not hot enough and the ash did not have the characteristic bright yellow mineral fluorescence. The samples instead had a very dull gold mineral fluorescence and the gamma amplitude matched the interval separating the C1 and C2 zones. This unexpected change in geology could only be explained by a 25-foot Down-to-the-North fault, contrary to the direction originally expected.
Nonetheless, the well had met its stratigraphic requirements by exposing at least 4000 feet of the target reservoir. By this time, however, the wellbore was becoming increasingly difficult to steer, due to torque and drag problems. The Geosteering Team therefore decided to TD the well.
The path of the wellbore that was planned based on seismic has been plotted in the previous figure. It should be apparent that if the proposed plan had been strictly navigated according to the original plan, the well would have been drilled out of zone. By anticipating changes in geology, the Geosteering Team was able to exploit the pay zone to the maximum extent before eventually being constrained by torque and drag problems.
Recommended for You
Preparing the Geosteering Plan
The Principles of Geosteering | Geosteering Best Practices
Assessment
In a typical drilling operation with geosteering what is the most expensive part?
A .Clean-up and stimulation
B .Pre-drilling costs
C .Surveying
D .Drilling operation itself Correct
E .Drill bits