Related Articles


Increasing Deliverability from a Gas Storage Field
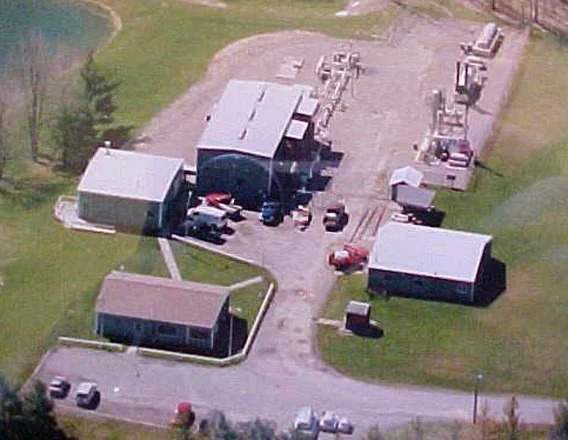
The Honeoye Storage Corporation (HSC) operates a gas storage facility in Ontario County, New York, about 40 miles south of Rochester (Figure 1: Regional setting for gas storage field). The Honeoye Field was discovered and developed by small Independent producers during the 1950s. When discovered, the field pay zone was found to be under-pressured, at 660 psi, typical of Silurian reservoirs in the region. This field produced dry gas to a point of depletion before HSC converted it to a gas storage facility in 1975 under a certificate from the Federal Energy Regulatory Commission (FERC) (Figure 2: Honeoye compression station). Since that time, HSC has boosted field capacity through FERC-authorized pressure increases from 660 psi to 775 psi in 1980, and from 775 psi to 1100 psi in 2000. In the most recent expansion, FERC authorized HSC to charge market-based rates for storage service. HSC therefore sought to increase revenue by drilling a horizontal well to enhance deliverability.

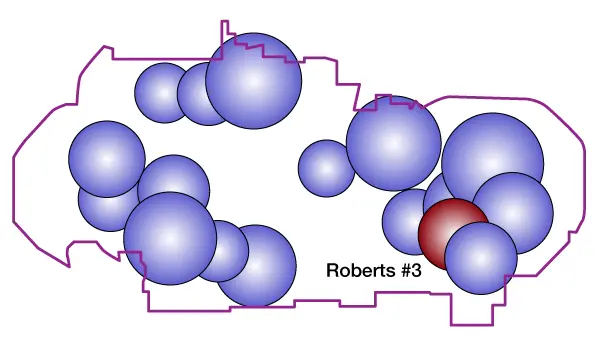
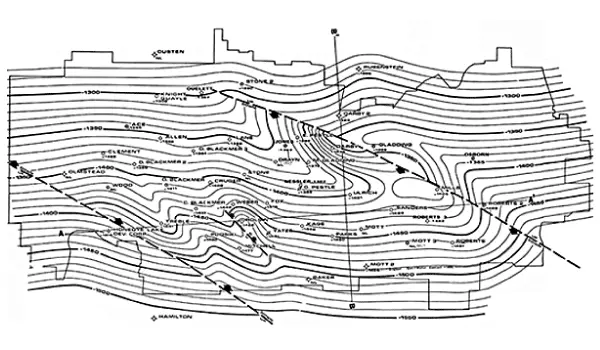
The Honeoye Field contains 27 operating wells and 12 observation wells, spread across a 3 × 7 mile area (Figure 3: Surveyor’s Plot of Gas Storage Field Map). The field is found at an average depth of 2750 feet, and produces from the Whirlpool Sandstone member of the Medina formation. The Whirlpool Sandstone is a sublittoral to shoreface marine sheet sandstone of Lower Silurian age. In this field, it is only 8-10 feet thick, and is characterized by very fine, predominantly loose quartz grains that are sub-angular to sub-round, ranging from clear to pink in color. The field is bounded by trapping faults to the east and west, a water contact to the south, and a facies change to shale at the north, along with shale and higher pressures above and below the reservoir (Figure 4: Field Structure Map, Top of Medina Formation).

HSC has taken weekly pressure readings on all observation and injection/withdrawal wells since 1975, and closely monitors the pressure-volume relationship of the field during each injection and withdrawal cycle. Seasonal pressure analysis showed that the eastern section of the reservoir was not being effectively utilized as part of the storage operation (Figure 5: Pressure Curve).