Related Articles


Capillary Pressure Tests
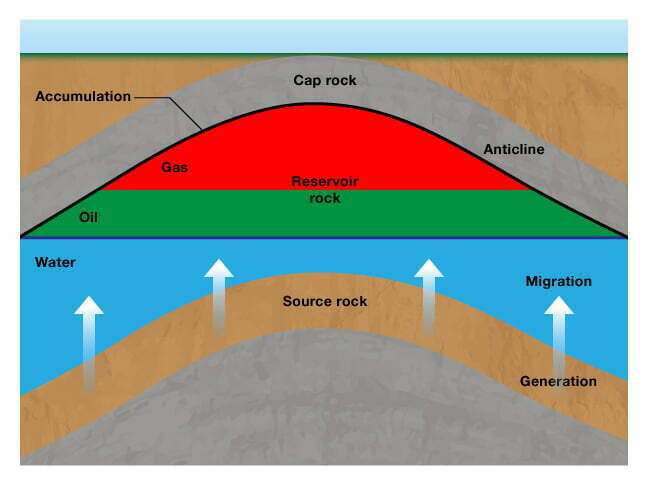
Water is retained in the reservoir’s pore space by capillary forces as hydrocarbons migrate and form an accumulation (Figure 1). Capillary action is the movement of a liquid along the surface of a solid caused by the attraction of molecules of the liquid to the molecules of the solid.
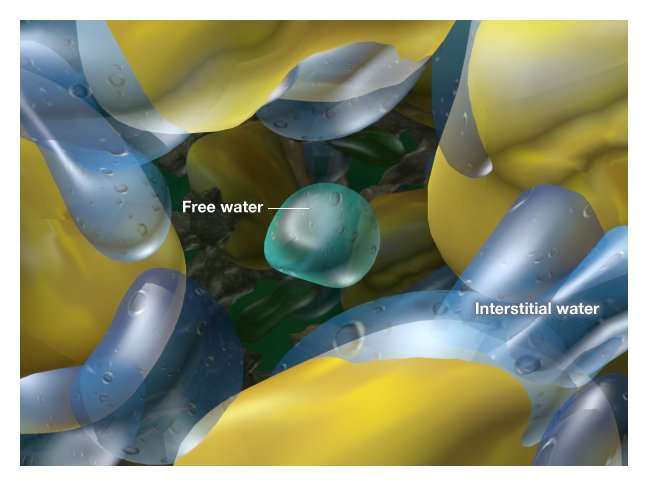
In water-wet reservoirs, this interstitial water adheres to the sandstone or carbonate surfaces (Figure 2). The retentive forces are proportional to the water-hydrocarbon interfacial tension and the affinity of water for the rock (its degree of wetting preference), and inversely proportional to the pore size.
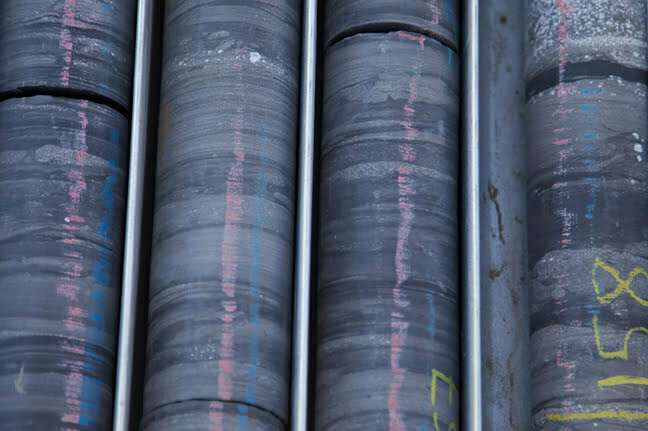
This implies that low permeability formations that are composed of very small pore spaces (Figure 3) have high water retentive forces, and hence generally have high immobile water saturations.
The measurement of capillary pressure requires that core samples be selected so that the pore radii distribution of the sample is representative of the reservoir. The data obtained in the test are used to define the initial water saturation distribution in the reservoir as a function of the height above the hydrocarbon-water contact, and to generate pore throat size and distribution data that are helpful in identifying the various rock types present in the formation.
Measurement Techniques
Three commonly used techniques for measuring capillary pressure data are the:
- restored state cell technique (Bruce and Welge, 1947)
- centrifugal technique (Slobod, Chambers and Prehn, 1951)
- mercury injection technique (Purcell, 1949)
All three techniques generate multiple saturation values so as to define water saturation as a function of the capillary pressure. The restored state technique has one advantage over the other two: water is present in the core samples, which allows their electrical properties to be measured along with the capillary pressure. The centrifugal technique is the most rapid analysis process and is the best method for poorly consolidated rocks, provided they have been mounted in sleeves with screens over the sample ends. The mercury injection technique generates the maximum number of data points. It is the best process for obtaining the pore throat distribution data, but the sample will be filled with mercury at the conclusion of the test and, therefore, will have no further value.
Figure 4 is a schematic of the restored state capillary pressure cell.
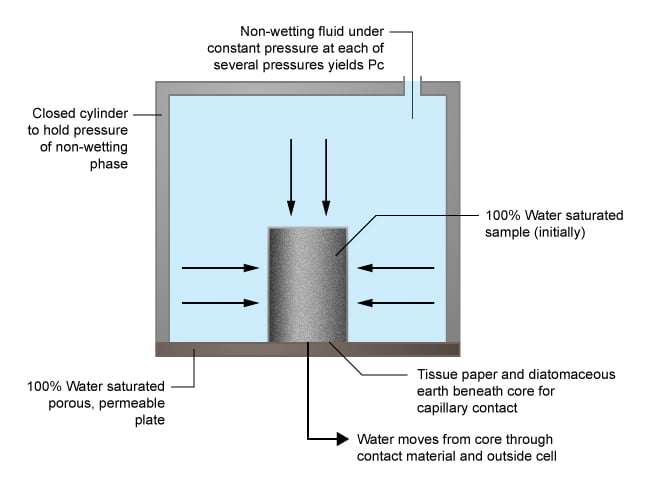
Clean, dry samples are weighed, evacuated, pressure-saturated with simulated formation brine, and then again weighed. Multiple samples of varying permeability can be run in one cell. The non-wetting phase is introduced at a low and constant pressure. This low pressure injection, which acts as a driving force to remove the water, is counterbalanced by the capillary retentive forces. When no further water is moving from the core at the imposed pressure level, the sample is removed and weighed. The water saturation remaining in the core is then determined gravimetrically.
The pressure imposed on the sample in the laboratory is equivalent to the pressure difference that exists between the wetting and non-wetting fluid phases. This, in turn, is proportional to the pressure difference between the wetting and non-wetting phase in the reservoir, which is related to the height of a given saturation above the original water-oil level and the oil and water hydrostatic gradients. Figure 5 illustrates this concept.
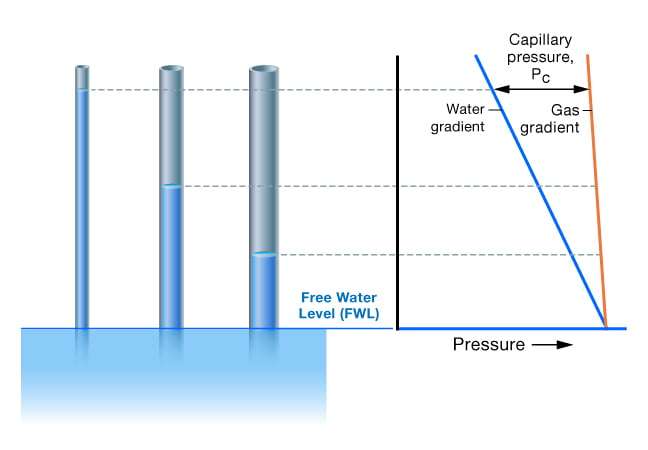
As the hydrocarbon column increases in height, the buoyant force of the hydrocarbon column increases. Water saturation is, therefore, pushed from the pore space and reduced to lower values as the height above the free water surface increases.
Figure 6 shows examples of capillary pressure data for rocks representative of three different depositional environments.
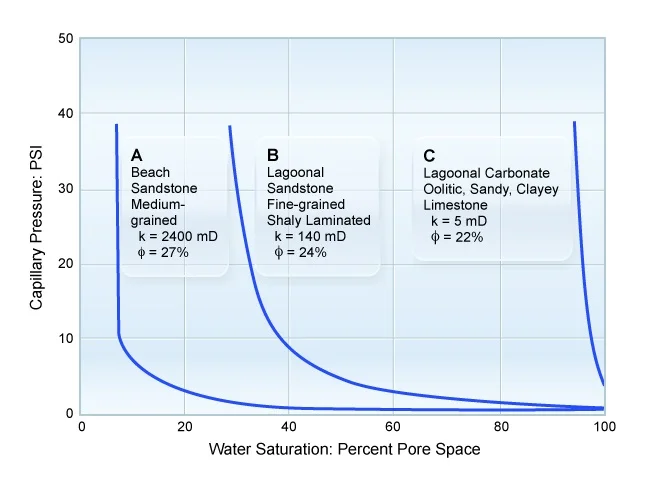
The higher permeability rocks have the lowest water saturation at any given capillary pressure, resulting in a shorter transition zone. The capillary pressure that yields a given water saturation is a function of the rock-wetting characteristics. Typically, this contact angle varies between the laboratory and the reservoir. Capillary pressure is also a function of the interfacial tension between the fluids in the core at the time of testing, which may differ from the reservoir value. One of the major uses of capillary pressure data is to define the initial water saturation of the reservoir.
Dernaika et al. (2013) compared multi-scale measurements on whole cores and adjacent core plugs to assess the effect of heterogeneity on the capillary pressure curves within a carbonate reservoir in the Middle East. The measurements were conducted at the reservoir temperature and net confining stress. The whole core primary drainage capillary curve averaged the variability seen from core plugs. For rock types with higher degrees of heterogeneity, whole core imbibition capillary pressure data were found to deviate from individual plug capillary pressure curves and to be a function of the relative presence of intermediate pore throats.
