Reef Interpretation
The quantity most often mapped in seismic interpretation is the difference of reflection time at the top and base of the interval loosely, this is a time thickness. A map of the contours of this quantity is therefore sometimes called a time isopach map (a map of equal time thicknesses). Some interpreters call it an isochron map (a map of equal times), but others reserve the term isochron to represent a normal contour of reflection time (on a time structure map). To avoid confusion, we shall call our map a time interval map.
The search for reefs on seismic sections may be simple, or it may be difficult. In Figure 1, we see an example of a simple case. The reef is clearly recognizable by its environment and by its characteristic form. But we are also concerned with reefs whose expression on the section is very subtle. Even if the seismic line passes right across the reef, the eye can scarcely detect any anomaly from the reef itself. Typical of such situations are the patch reefs of Alberta and the Michigan peninsula.
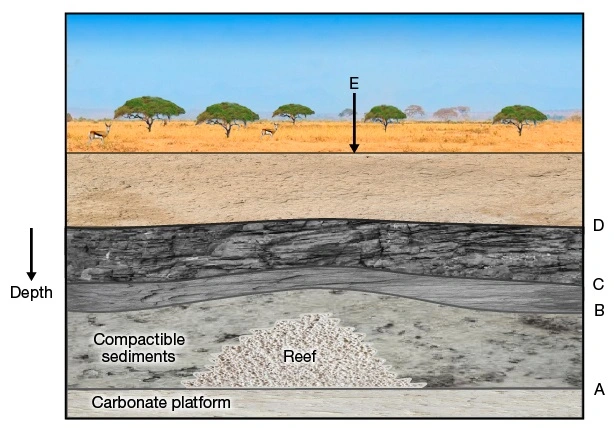
We search for these subtle reefs by time interval mapping. In some areas, the rationale for this approach results from the situation shown in Figure 2, in which a patch reef has grown on a carbonate platform, and has later become surrounded by clays or lime muds. The latter are more compactable than the reef, so that the weight of later sediments causes the appearance of draping over the reef. Therefore, even if the reef is not directly visible on the section, its presence can be inferred by mapping the time interval between the reflections from interfaces A and B. The reef is represented by a “thick” an increase of the time interval between these interfaces.
Sometimes the effect of velocity yields a “thin”—a local decrease of the time interval between two interfaces. In fact, a thin and a thick (due to differential compaction) can exist together, though the one tends to nullify the other. In this situation, the soundest technique may be to map the interval B-C (or B-D, or C-D) in Figure 2, to search for a thin.
The technique of interval mapping may be of value even when the reef itself is clearly visible on the seismic section. In considering the grid of lines necessary to find small patch reefs in a new license area, we may observe that the cost could be reduced significantly if we could detect a reef from a line which passed near the reef but not actually over it. If we look again at Figure 2, we see that the mapping of a time interval (in search of either a thick or a thin) may do this for us. A line perpendicular to the plane of the paper, at location E, might well detect the presence of the reef without passing over it.
The same advantage applies where line locations are constrained by limited access. We may be forced to work only along roads in built-up areas, or only along rivers in jungle areas. Then time interval mapping may increase our chances of spotting a reef not directly underlying a line.
In other areas, the reason for using time interval mapping may result from the situation shown in Figure 3. The actual situation, plotted in depth, is that of image A. The resulting seismic section, plotted in reflection time, is that of image B. The reef has a higher velocity than that of the surrounding sediments, so that a reflection from below the reef shows velocity pull-up. If we map the time interval between reflection D and reflection C (or any deeper reflection), we can hope to infer the presence of the reef from a thin.

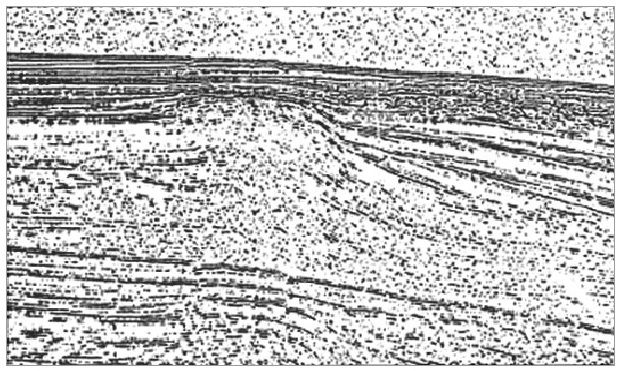
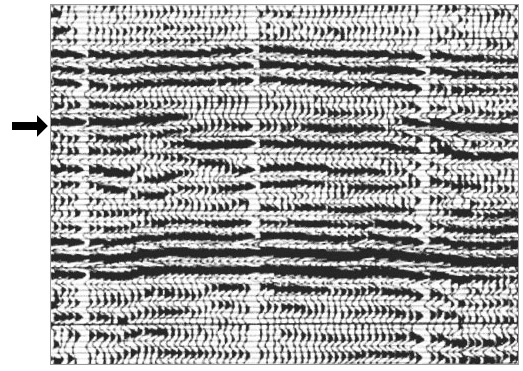
Figure 4 is an example of a reef where these time interval techniques could supplement the direct recognition of the reef.
The technique of time interval mapping is also valuable for targets other than reefs. Draping, and the consequent thickening or thinning of an interval, is likely to occur above any geological body whose resistance to compaction during burial is different from that of the rocks each side of it. Thus, an erosional channel cut into a sand-shale sequence and filled with sand shows anomalously small compaction (a thick), but if it is filled with clay it shows anomalously large compaction (a thin). A sand bar, often an important reservoir, can be mapped as a thick. Growth faults can be distinguished and studied, if corresponding intervals can be identified and mapped on the upthrown side (thin) and the downthrown side (thick). And we remember that tilting during deposition may show as a systematic thickening in the direction of greatest subsidence, or a thinning in the direction of uplift.
 Petro Shine The Place for Oil and Gas Professionals.

