Related Articles


Algorithms and Histograms
Algorithms quick-look well log interpretation
Today, much of what historically was done by reference to logging service company charts is achieved with sophisticated software programs. Moreover, with each generation of LWD and wireline logging tools, an ever-increasing number of environmental and other normalization corrections are made in real time.
However, there still remain a few applications for algorithms in quick-look well log interpretation. As an example, the temperature measurements from maximum-reading thermometers in logging tools will help to establish the bottomhole temperature as a new well section is being drilled. A useful application of these real-time temperature data is to estimate the temperature gradient as shown in Figure 1. Knowledge of the temperature gradient and the bottomhole temperature will have operational implications for the robustness of various hardware and equipment to be run in the borehole later in the well, as well as potential interpretation applications for the hydrocarbon maturity which may establish a prudent maximum eventual wellbore depth of an exploration well.

Similarly, it is beneficial to have an algorithm for making temperature corrections to the resistivity of the mud filtrate measured at surface conditions and those conditions in the downhole environment, using Figure 2. This will facilitate more accurate estimates of the water saturation in the invaded zone, Sxo.

A third use of an algorithm might be to generate a quick-look, and very approximate, initial permeability estimate from the quick-look porosity and water saturation estimates as shown in Figure 3.

Histograms
Histograms of raw well log data and computed log analysis results (Figure 4) are useful tools for the petrophysicist.
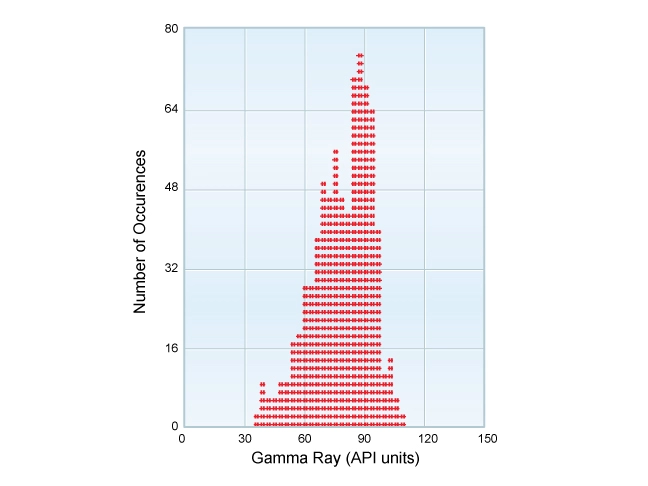
The y-axis of a histogram is usually scaled either in the actual number of the data occurrences or in a percentage of the total number of data points analyzed. The x-axis is normally linearly scaled over the full range of the particular well log data element being analyzed. Histograms are useful for picking data minima and maxima, rescaling old and poorly calibrated logs and checking the validity of computed results.
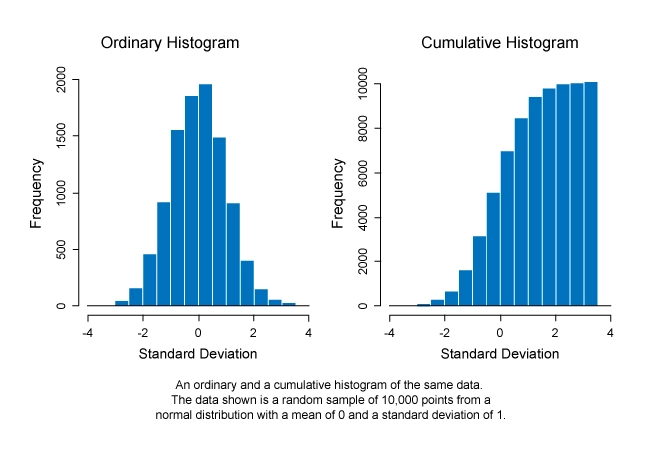
Histograms can be displayed either in an ordinary histogram format or as a cumulative histogram (Figure 5).
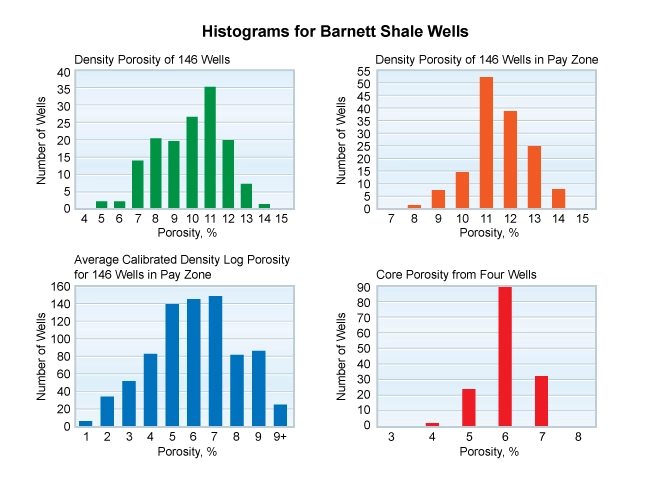
Histograms can be useful for comparing the log data from a new well drilled in a field with the existing field well database, as shown for the data in Figure 6 for wells in the unconventional resource Barnett shale.
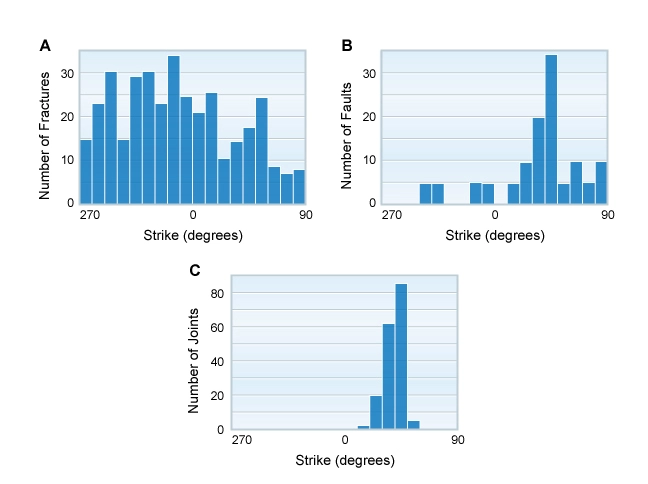
Another application of histograms is to review and compare the strike direction of fractures indicated on borehole imaging devices with those from faults (Figure 7).