Related Articles


Porosity Log Combinations
Well Log Data Acquisition and Interpretation Preparations
Porosity is one of the critical formation parameters used for estimating the volume of hydrocarbons in place (STOIIP and GIIP) in a hydrocarbon accumulation. Petrophysicists have a number of options for calculating the porosities from well logs, and these alternatives enable them to make the most accurate porosity estimates for a range of situations. The three main porosity tools, available with both logging while drilling (LWD) and wireline tool conveyancing methods, generate compensated neutron porosity, formation density together with a photoelectric factor measurement, and sonic logs. These logging tools, irrespective of whether they are acquired by LWD or wireline, are sensitive to the formation rock matrix material, shale content, porosity and fluid content of the pore spaces.
It is still a fairly common practice to conduct the main petrophysical interpretation in vertical and low deviation angle wells using wireline conveyed logging tools. In higher deviation angle wells, often due to tool conveyancing difficulties, either LWD or combinations of wireline and LWD are generally preferred. In a few challenging offshore appraisal and development wells with complex geology (Ferraris et al., 2012), a pilot vertical well is drilled, and only the basic resistivity, density and neutron porosity LWD data are acquired. This is followed by a comprehensive wireline logging program consisting of array induction, neutron density, nuclear magnetic resonance and elemental spectroscopy, together with formation pressure measurements and fluid samples.
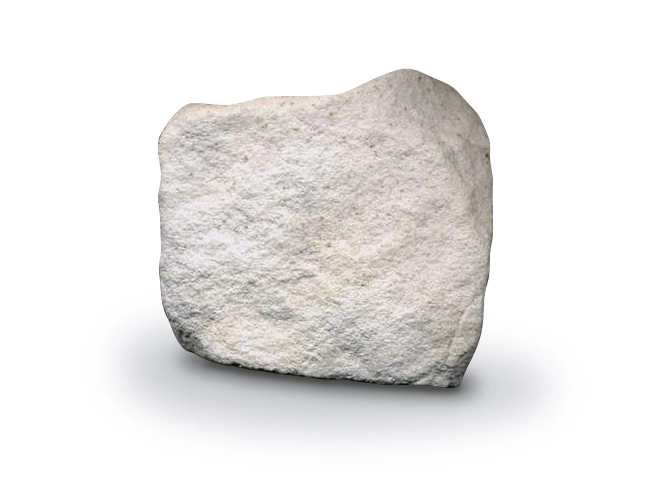
Homogeneous, clean (shale-free) water-bearing formations (Figure 1) of known and consistent lithology are the simplest rocks for well log porosity determination, because there are no complicating effects of varying lithology, shales or hydrocarbons. Before discussing log analysis techniques, however, a review of the scales used on porosity logs and the procedures and techniques used to read them will be presented.
All well log data are recorded digitally, and most petrophysical analyses are conducted using each company’s preferred well log interpretation software. When reviewing playbacks of digital well log data, three factors must be determined before reading the log:
- The type of curve recorded—e.g., bulk density, photoelectric factor, sonic travel time and, in the case of neutron porosity curves, confirmation that it is based on a limestone matrix scale
- The log scale, measurement units and the log track used
- Local geological knowledge, such as the likely lithology, stratigraphy and formation fluid content
Once this information is assimilated, the formation porosity can be determined in those intervals where log quality assurance has confirmed the well log data’s integrity. With a pad contact device such as the density tool, log quality control should be particularly rigorous in very rugose boreholes and any invalid data identified and edited appropriately.
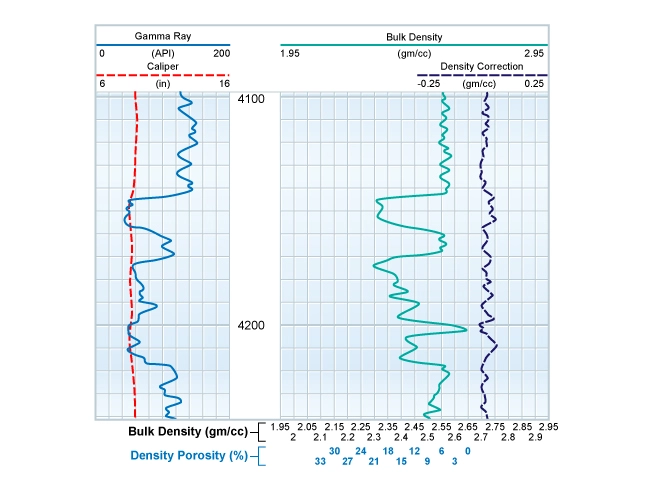
With the density log standard scaling from 1.95 to 2.95 gm/cc from left to right across 20 divisions, each chart division represents 0.05 gm/cc, as shown in Figure 2. On this basis, it is a simple matter to determine the bulk density, ρb, in gm/cc. The range of bulk densities encountered in sandstones, for example, is from 1.00 gm/cc (water) in a theoretical 100% porosity to approximately 2.65 gm/cc at zero porosity. Thus, a spread of 1.65 gm/cc represents a spread of 100 porosity units (P.U.), and each of the twenty log-scaling divisions represents 0.05 gm/cc. The number of P.U. in a scale division can be determined as follows:


Thus, for all practical purposes, the log scale is in increments of 3 P.U. starting with 0 P.U. at 2.65 gm/cc. The error at 30 P.U.s is only 0.3 P.U., or 1%.
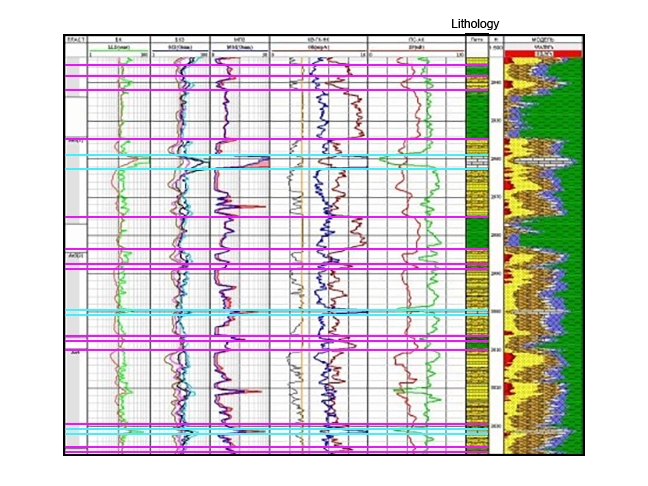
It is important to divide the interval to be analyzed into several coherent zones, each displaying its own distinctive characteristics, such as the different formations determined by the geologist or as indicated by the log character being relatively consistent within each defined zone. Such careful zonation, as shown in Figure 3, assists in the selection of the appropriate optimal petrophysical parameters, such as the matrix density and velocity, for each zone being analyzed.
Porosity Logs in Combination
Normally, a combination of porosity well log devices are run together in an open wellbore, either as part of the bottomhole assembly with logging while drilling (LWD) tools, or on wireline. Porosity log combinations with valid data always define porosity better than any single porosity device by itself. The two porosity tools most commonly run as a pair are the density and neutron porosity combination. Many companies now consistently plot their density logs on a 1.95 to 2.95 gm/cc scale with a compatible 45% to -15% neutron porosity on a limestone matrix scale. The two logs are thus on compatible limestone scales, with 0% neutron porosity equivalent to a bulk density of 2.7 gm/cc. Both logs then read the true formation porosity if the lithology is pure limestone and there are no shale or hydrocarbon effects.
Density-Neutron Crossplots
The most effective method of analyzing density and neutron porosity logs together is with a crossplot. Figure 4 shows the three formation rock matrix lines for sandstone, limestone and dolomite plotted on a standard format density-neutron crossplot template, each with the porosities ranging from zero porosity to the highest encountered reservoir porosities of around 40% indicated.
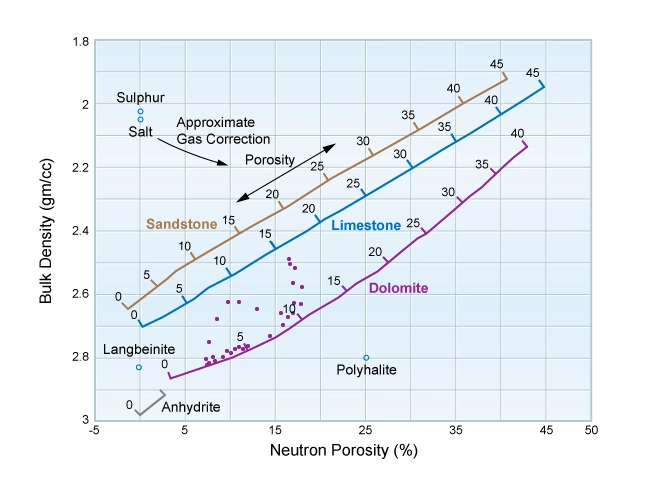
One of the several advantages of the density-neutron crossplot is that the porosity generated is relatively unaffected by an unknown or varying lithology. As an example, a number of density and neutron log data points are shown on Figure 4, which all plot between the limestone and dolomite matrix lines at porosities of up to 15 P.U. Projecting these points onto the lines of equal porosity between the limestone and dolomite rock matrices allows an accurate porosity to be estimated within about 1 P.U., whether the formation is actually 75% limestone and 25% dolomite, or vice versa. By contrast, choosing a different matrix density value or matrix for the neutron porosity log or matrix travel time when using the density, neutron or sonic logs individually might change the calculated porosity by several P.U.
Correction for any gas effect on the density and neutron porosity logs using the density-neutron crossplot is possible. Computer algorithms which iterate until there is stability and reasonableness on the calculated matrix density are much preferred for a density-neutron crossplot gas correction, but an approximate gas correction direction (primarily a function of the gas density) towards the southeast corner of the crossplot is indicated on Figure 4 to enable a quick-look visual, or manual, correction for the presence of gas.
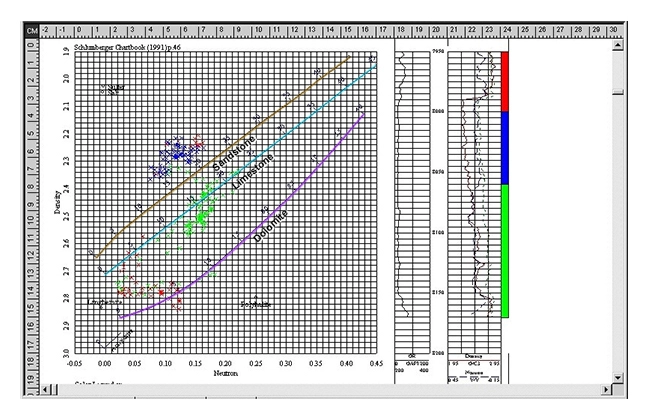
Figure 5 shows a gas-bearing, slightly dolomitic limestone interval indicated by the blue section of the stratigraphic column on the right of the figure and the corresponding blue points plotted on the density-neutron crossplot. Immediately below this gas-bearing interval in the well is a water-bearing interval of the same slightly dolomitic limestone formation, indicated in green on both the stratigraphic column and the density-neutron crossplot. For the clean, water-bearing, slightly dolomitic limestone sections, the porosities can be read directly from the neutron-density crossplot. For the gas-bearing section at the top of this formation, a gas correction is required which will take the blue points, in a southeasterly direction as a function of the gas density, onto the very slightly dolomitic limestone trend of the green points. Porosities, having been corrected for the effect of gas, can then be read off the crossplot. Once again, this gas correction procedure is best conducted in an iterative manner by computer until the calculated matrix density reaches stability, which in this case of a slightly dolomitic limestone might be around 2.74 gm/cc.
In a similar process, corrections can be made for the shale content of a formation in order to establish the shale-corrected porosities using a density-neutron crossplot. Figure 6 shows an interval which is predominantly clean, water-bearing sandstone with a range of porosities, indicated by the green points on the crossplot. However, there are shaly intervals within these data, indicated by the yellow and orange points. The density and neutron porosity log responses to the main interval of 100% shale are determined to be 2.4 gm/cc and 50% neutron porosity. Points with 0% shale volume will plot on and around the sandstone matrix line depending on their porosity, unless there is a gas effect. Such a gas effect would move points in a northwesterly direction on the density-neutron crossplot.

The shale correction process works as follows: The shale volume of each data point is calculated, ideally by using an independent shale volume indicator such as a gamma ray or a spectral gamma ray. Corrections for their respective shale contents are made for each point, moving the points in a direction towards the sandstone matrix line and 180 degrees away from the established “shale trend towards 2.4 gm/cc and 50% neutron porosity.” The higher the estimated shale volume, the larger the shale correction back towards the northwest of the crossplot will be. Once again, this process is only realistically carried out in a reasonable time period by using digital log data and appropriate computer algorithms.
Alternatives to the Density-Neutron Crossplot
Regardless of the formation’s actual lithology, an approximation of the porosity can be made by combining the neutron (limestone matrix) porosity with the density (limestone matrix) porosity in the following manner:

Where:
ϕn is the neutron porosity run on a limestone matrix.
ϕd is the density porosity assuming a limestone matrix.
This porosity estimation technique works reasonably well even in gas bearing reservoirs, since it is a weighted average of density porosity and neutron porosity, which are affected by the presence of gas in opposing directions. In a gas bearing interval, the density porosity will be too high and the neutron porosity will be too low. Therefore, by taking a weighted average of the two, the gas effect is minimized.
However, this approximation results in a less accurate solution to porosity determination than the density-neutron crossplot. In particular, it is inaccurate in low porosity dolomite, and its use in such cases is not recommended.
Another porosity approximation combining the density and neutron porosities can also be made as follows:

The square root in the equation above tends to suppress the effects of any residual gas in the flushed zone investigated by the density and neutron porosity logging tools.
Density-Sonic Crossplot
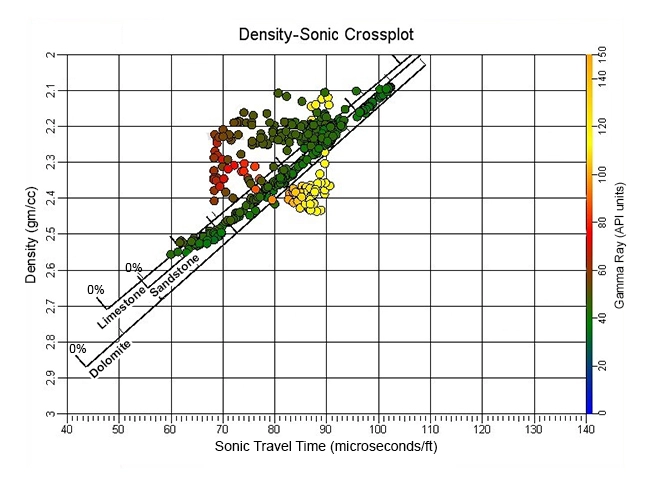
Although it has some useful interpretation attributes, such as estimating the shale volume and identifying evaporitic minerals, the density-sonic crossplot has limited applications for log porosity estimation. As Figure 7 shows, the sandstone, limestone and dolomite matrix lines are closely spaced together on the crossplot as their matrix velocities and densities are relatively close, but the porosity values on each of the three matrix lines are significantly offset. This is most clearly shown by comparing the three zero porosity points for the three rock types. The choice of the lithology pair has a very significant effect on the porosity estimate. Consequently, porosity derivation from the density-sonic crossplot is vulnerable to inaccuracy even if the matrix is well known and is not a recommended practice, especially if the density-neutron crossplot is available.
Sonic-Neutron Crossplot
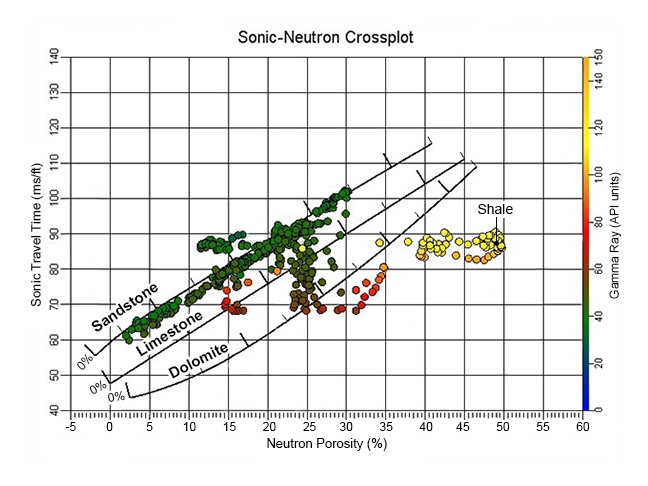
The sonic-neutron crossplot (Figure 8) has an application as a backup to the density-neutron crossplot. The 100% shale point is normally easily identifiable, but the equi-porosity lines for the three matrix lines of sandstone, limestone and dolomite are only quasi-parallel to both the gas correction and shale correction trend lines. Consequently, the sonic-neutron crossplot can only play a secondary role in log porosity determination.
Multi-Mineral Elemental Analysis Techniques
In contrast to deterministic log analysis techniques, some vendors offer proprietary multi-mineral elemental analysis well log interpretation programs. These analyses compute the most probable formation mineralogy and pore fluid volumes using a multi-log, least squares inversion technique. Such petrophysical techniques are most applicable in reservoirs of mixed lithologies and mineralogies, as well as in dual porosity reservoir systems. However, the correct identification of the minerals likely to be encountered is critical to constraining the number of possible solutions and generating a plausible log interpretation. Valdisturio et al. (2013) presented a case study of the workflow for such a petrophysical interpretation technique using LWD data from horizontal wells.
Summary
In clean, water-bearing formations of known and constant lithology, porosity may be determined from any of the three common porosity tools alone. However, this situation is not very common, and thus this approach is not recommended unless there are no other valid porosity data available.
If good quality density and neutron porosity data are available, they should be used together in preference to using any of the porosity logs individually, irrespective of the lithology, shale and hydrocarbon content.
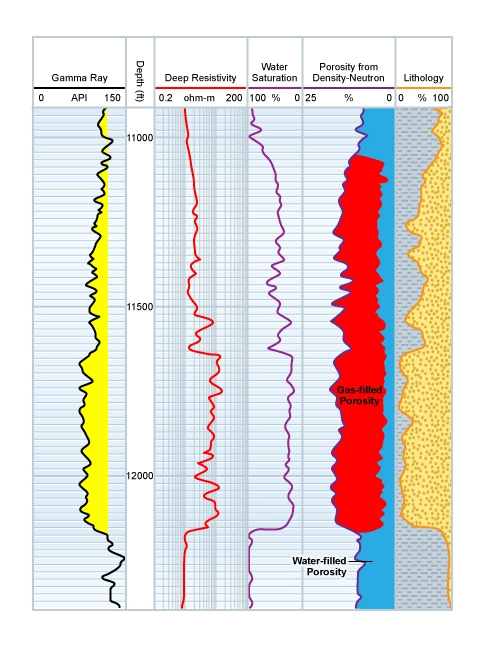
Using the density-neutron crossplot, either manually or digitally on a computer, provides a good and reliable porosity solution within narrow bounds. When gas is also present, a computerized petrophysical evaluation (Figure 9) is strongly advised, and the density-neutron crossplot, used in an iterative process, can generate high-quality porosity calculations.
To generate reliable log porosity data and information, the minimum tool combination required is the neutron porosity and density. For best possible results, and to better tie the well to seismic data, all three common porosity tools—neutron porosity, density and sonic—should be run.
