ad
GeologyPetrophysics

Lithology Identification From Well Logs

Spontaneous Potential (SP) Logs


The spontaneous potential (SP) well log is a continuous recording of the electrical potential difference between a movable electrode on a logging tool positioned within the open borehole and a static electrode positioned at the surface (Figure 1).

The SP requires electrical conductivity, so it cannot be generated in those wells where the borehole is filled with non-conductive oil base drilling mud or air. Because of the requirement for a grounded voltage at the surface, it is only practical to acquire good quality SP logs with wireline conveyance logging systems. In the offshore drilling environment, it is often more challenging to obtain good grounding for the SP log than in onshore well logging operations. Consequently, the gamma ray has a more dominant role as a shale volume and bed boundary indicator when well logging in offshore locations.

Spontaneous potential (SP) log acquisition schematic, Spontaneous potential, lithology, lithology indicator, lithology determination from well logs, types of well logging, how to identify pine logs, lithology identification from well logs, lithology interpretation from logs, lithology logging, lithology identification, lithology identification from well logs, lithology interpretation from logs, lithology logging, lithology identification, lithology identification from well logs, lithology interpretation from logs, lithology logging, lithology identification, lithology identification from well logs, lithology interpretation from logs, lithology logging, lithology identification, lithology identification from well logs, lithology interpretation from logs, lithology logging, lithology identification, lithological logs, lithology identification from well logs, lithology interpretation from logs, lithology logging, lithology identification, lithology identification from well logs, lithology interpretation from logs, lithology logging, lithology identification, lithological logs, lithology identification from well logs, lithology interpretation from logs, lithology logging, lithology identification, lithological logs, lithology identification from well logs, lithology interpretation from logs, lithology logging, lithology identification, lithological logs, lithology identification from well logs, lithology interpretation from logs, lithology logging, lithology identification, lithology identification from well logs, lithology interpretation from logs, lithology logging, lithology identification, lithology identification from well logs, lithology interpretation from logs, lithology logging, lithology identification, lithology identification from well logs, lithology interpretation from logs, lithology logging, lithology identification, lithology identification from well logs, lithology interpretation from logs, lithology logging, lithology identification, lithological logs, lithology identification from well logs, lithology interpretation from logs, lithology logging, lithology identification, lithology identification from well logs, lithology interpretation from logs, lithology logging, lithology identification, lithology identification from well logs, lithology interpretation from logs, lithology logging, lithology identification, lithology identification from well logs, lithology interpretation from logs, lithology logging, lithology identification, lithology identification from well logs, lithology interpretation from logs, lithology logging, lithology identification, lithology identification from well logs, lithology interpretation from logs, lithology identification, lithology logging, lithology identification from well logs, lithology interpretation from logs, lithology logging, lithology identification, lithology identification from well logs, lithology interpretation from logs, lithology logging, lithology identification, lithology identification from well logs, lithology interpretation from logs, lithology logging, lithology identification, lithological logs, Rock type determination, Formation evaluation, Log interpretation, Well logging techniques, Well log analysis, Borehole geophysics, Geophysical logs, Wireline logging, Well log data, Lithologic characterization, Log-based lithology, Well log interpretation, Lithological identification, Formation lithology, Logging tools, Geologic interpretation, Logging parameters, Well log response, Sedimentary rocks identification, Reservoir characterization, Stratigraphic interpretation, Log-derived lithology, Rock properties estimation
Figure 1: Spontaneous potential (SP) log acquisition schematic

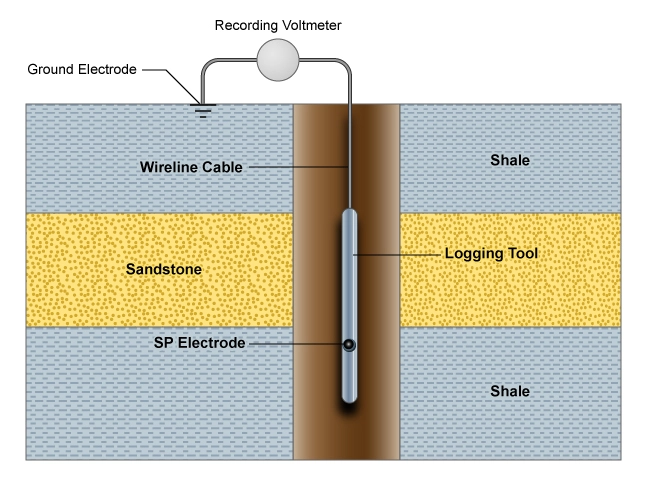
Figure 2 shows SP currents in the borehole and the adjacent formations. The direction of currents indicated corresponds to the situation when the salinity of the formation water is greater than that of the drilling mud filtrate, producing a potential by the permeable sandstone that is lower than the potential by the shale. This corresponds to a deflection to the left on the SP log by the sandstone.

If the drilling mud filtrate salinity is greater than the formation water salinity, then the currents flow in the opposite direction, and this produces positive SP deflections. If the salinities of the mud filtrate and formation water are essentially the same, then the SP log curve is flat and featureless.

SP currents in the borehole and the adjacent formations, lithology, lithology indicator, lithology determination from well logs, types of well logging, how to identify pine logs, lithology identification from well logs, lithology interpretation from logs, lithology logging, lithology identification, lithology identification from well logs, lithology interpretation from logs, lithology logging, lithology identification, lithology identification from well logs, lithology interpretation from logs, lithology logging, lithology identification, lithology identification from well logs, lithology interpretation from logs, lithology logging, lithology identification, lithology identification from well logs, lithology interpretation from logs, lithology logging, lithology identification, lithological logs, lithology identification from well logs, lithology interpretation from logs, lithology logging, lithology identification, lithology identification from well logs, lithology interpretation from logs, lithology logging, lithology identification, lithological logs, lithology identification from well logs, lithology interpretation from logs, lithology logging, lithology identification, lithological logs, lithology identification from well logs, lithology interpretation from logs, lithology logging, lithology identification, lithological logs, lithology identification from well logs, lithology interpretation from logs, lithology logging, lithology identification, lithology identification from well logs, lithology interpretation from logs, lithology logging, lithology identification, lithology identification from well logs, lithology interpretation from logs, lithology logging, lithology identification, lithology identification from well logs, lithology interpretation from logs, lithology logging, lithology identification, lithology identification from well logs, lithology interpretation from logs, lithology logging, lithology identification, lithological logs, lithology identification from well logs, lithology interpretation from logs, lithology logging, lithology identification, lithology identification from well logs, lithology interpretation from logs, lithology logging, lithology identification, lithology identification from well logs, lithology interpretation from logs, lithology logging, lithology identification, lithology identification from well logs, lithology interpretation from logs, lithology logging, lithology identification, lithology identification from well logs, lithology interpretation from logs, lithology logging, lithology identification, lithology identification from well logs, lithology interpretation from logs, lithology identification, lithology logging, lithology identification from well logs, lithology interpretation from logs, lithology logging, lithology identification, lithology identification from well logs, lithology interpretation from logs, lithology logging, lithology identification, lithology identification from well logs, lithology interpretation from logs, lithology logging, lithology identification, lithological logs, Rock type determination, Formation evaluation, Log interpretation, Well logging techniques, Well log analysis, Borehole geophysics, Geophysical logs, Wireline logging, Well log data, Lithologic characterization, Log-based lithology, Well log interpretation, Lithological identification, Formation lithology, Logging tools, Geologic interpretation, Logging parameters, Well log response, Sedimentary rocks identification, Reservoir characterization, Stratigraphic interpretation, Log-derived lithology, Rock properties estimation
Figure 2: SP currents in the borehole and the adjacent formations

The SP currents flow through four different media:

  • The drilling mud fluid in the borehole
  • The zone flushed by drilling mud filtrate adjacent to the open wellbore
  • The uninvaded zone of the permeable formation
  • The adjacent shales

The SP log measures only the potential drop from the SP currents in the borehole fluid, which may not represent the total SP because there are also potential drops in the formation. If the currents could be interrupted by hypothetical insulating plugs (Figure 2a), the potential observed in the mud would be the total spontaneous potential. This idealized SP deflection is called the static SP (SSP). In thick, clean formations, the SP deflection nearly reaches the SSP.

The borehole presents a much smaller cross-sectional area to current flow than the formations around it, so the resistance of the borehole part of the SP current loop is much higher than the formation part. Nearly all the SP potential drop, therefore, occurs in the borehole if formation resistivities are low and the formation beds are thick.

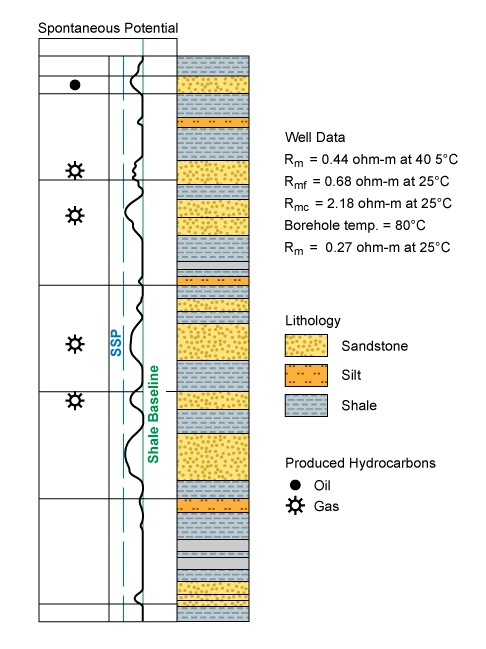
Adjacent to shale beds of significant thickness, spontaneous potential (SP) log readings usually form an approximately straight line (Figure 3), termed the shale baseline. The shale baseline is the average reading of the SP log opposite the thick shale layers in a well.


Rock type determination, Formation evaluation, Log interpretation, Well logging techniques, Well log analysis, Borehole geophysics, Geophysical logs, Wireline logging, Well log data, Lithologic characterization, Log-based lithology, Well log interpretation, Lithological identification, Formation lithology, Logging tools, Geologic interpretation, Logging parameters, Well log response, Sedimentary rocks identification, Reservoir characterization, Stratigraphic interpretation, Log-derived lithology, Rock properties estimation, Shale baseline on an SP log opposite shale intervals, lithology, lithology indicator, lithology determination from well logs, types of well logging, how to identify pine logs, lithology identification from well logs, lithology interpretation from logs, lithology logging, lithology identification, lithology identification from well logs, lithology interpretation from logs, lithology logging, lithology identification, lithology identification from well logs, lithology interpretation from logs, lithology logging, lithology identification, lithology identification from well logs, lithology interpretation from logs, lithology logging, lithology identification, lithology identification from well logs, lithology interpretation from logs, lithology logging, lithology identification, lithological logs, lithology identification from well logs, lithology interpretation from logs, lithology logging, lithology identification, lithology identification from well logs, lithology interpretation from logs, lithology logging, lithology identification, lithological logs, lithology identification from well logs, lithology interpretation from logs, lithology logging, lithology identification, lithological logs, lithology identification from well logs, lithology interpretation from logs, lithology logging, lithology identification, lithological logs, lithology identification from well logs, lithology interpretation from logs, lithology logging, lithology identification, lithology identification from well logs, lithology interpretation from logs, lithology logging, lithology identification, lithology identification from well logs, lithology interpretation from logs, lithology logging, lithology identification, lithology identification from well logs, lithology interpretation from logs, lithology logging, lithology identification, lithology identification from well logs, lithology interpretation from logs, lithology logging, lithology identification, lithological logs, lithology identification from well logs, lithology interpretation from logs, lithology logging, lithology identification, lithology identification from well logs, lithology interpretation from logs, lithology logging, lithology identification, lithology identification from well logs, lithology interpretation from logs, lithology logging, lithology identification, lithology identification from well logs, lithology interpretation from logs, lithology logging, lithology identification, lithology identification from well logs, lithology interpretation from logs, lithology logging, lithology identification, lithology identification from well logs, lithology interpretation from logs, lithology identification, lithology logging, lithology identification from well logs, lithology interpretation from logs, lithology logging, lithology identification, lithology identification from well logs, lithology interpretation from logs, lithology logging, lithology identification, lithology identification from well logs, lithology interpretation from logs, lithology logging, lithology identification, lithological logs
Figure 3: Shale baseline on SP log in shale sections

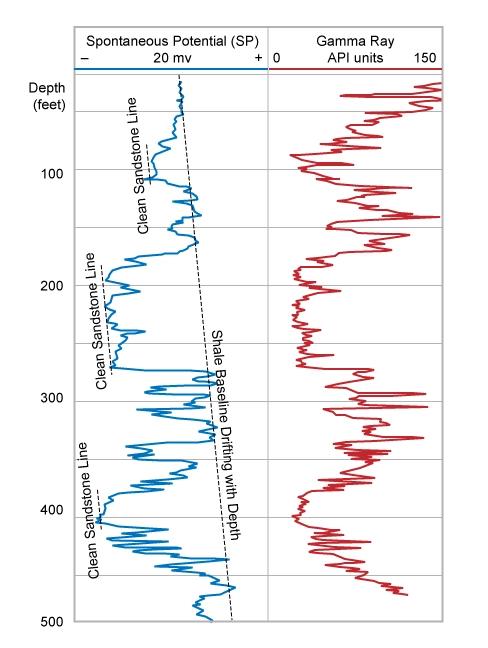
Opposite shales, the SP log reading is relatively constant and changes only slowly with depth, although it may steadily drift in some situations (Figure 4). This characteristic is commonly observed in shallow sections in onshore locations and is often caused by increases in the relative oxidization of the rocks that are close to the land surface.

Rock type determination, Formation evaluation, Log interpretation, Well logging techniques, Well log analysis, Borehole geophysics, Geophysical logs, Wireline logging, Well log data, Lithologic characterization, Log-based lithology, Well log interpretation, Lithological identification, Formation lithology, Logging tools, Geologic interpretation, Logging parameters, Well log response, Sedimentary rocks identification, Reservoir characterization, Stratigraphic interpretation, Log-derived lithology, Rock properties estimation, Shale baseline from SP drifting with depth, shale, lithology, lithology indicator, lithology determination from well logs, types of well logging, how to identify pine logs, lithology identification from well logs, lithology interpretation from logs, lithology logging, lithology identification, lithology identification from well logs, lithology interpretation from logs, lithology logging, lithology identification, lithology identification from well logs, lithology interpretation from logs, lithology logging, lithology identification, lithology identification from well logs, lithology interpretation from logs, lithology logging, lithology identification, lithology identification from well logs, lithology interpretation from logs, lithology logging, lithology identification, lithological logs, lithology identification from well logs, lithology interpretation from logs, lithology logging, lithology identification, lithology identification from well logs, lithology interpretation from logs, lithology logging, lithology identification, lithological logs, lithology identification from well logs, lithology interpretation from logs, lithology logging, lithology identification, lithological logs, lithology identification from well logs, lithology interpretation from logs, lithology logging, lithology identification, lithological logs, lithology identification from well logs, lithology interpretation from logs, lithology logging, lithology identification, lithology identification from well logs, lithology interpretation from logs, lithology logging, lithology identification, lithology identification from well logs, lithology interpretation from logs, lithology logging, lithology identification, lithology identification from well logs, lithology interpretation from logs, lithology logging, lithology identification, lithology identification from well logs, lithology interpretation from logs, lithology logging, lithology identification, lithological logs, lithology identification from well logs, lithology interpretation from logs, lithology logging, lithology identification, lithology identification from well logs, lithology interpretation from logs, lithology logging, lithology identification, lithology identification from well logs, lithology interpretation from logs, lithology logging, lithology identification, lithology identification from well logs, lithology interpretation from logs, lithology logging, lithology identification, lithology identification from well logs, lithology interpretation from logs, lithology logging, lithology identification, lithology identification from well logs, lithology interpretation from logs, lithology identification, lithology logging, lithology identification from well logs, lithology interpretation from logs, lithology logging, lithology identification, lithology identification from well logs, lithology interpretation from logs, lithology logging, lithology identification, lithology identification from well logs, lithology interpretation from logs, lithology logging, lithology identification, lithological logs
Figure 4: Shale baseline from SP drifting with depth

Shifts in the baseline can sometimes be observed, for example, when permeable beds with different formation water salinities are separated by shales that are not a perfect cationic membrane (Figure 5). The SP curve should be continuous throughout the logged interval. (In this illustration it is obscured in places by the vertical grid line in the lower middle section.)

SP shifts due to formation water salinity changes, lithology, lithology log, lithology indicator, lithology determination from well logs, types of well logging, how to identify pine logs, lithology identification from well logs, lithology interpretation from logs, lithology logging, lithology identification, lithology identification from well logs, lithology interpretation from logs, lithology logging, lithology identification, lithology identification from well logs, lithology interpretation from logs, lithology logging, lithology identification, lithology identification from well logs, lithology interpretation from logs, lithology logging, lithology identification, lithology identification from well logs, lithology interpretation from logs, lithology logging, lithology identification, lithological logs, lithology identification from well logs, lithology interpretation from logs, lithology logging, lithology identification, lithology identification from well logs, lithology interpretation from logs, lithology logging, lithology identification, lithological logs, lithology identification from well logs, lithology interpretation from logs, lithology logging, lithology identification, lithological logs, lithology identification from well logs, lithology interpretation from logs, lithology logging, lithology identification, lithological logs, lithology identification from well logs, lithology interpretation from logs, lithology logging, lithology identification, lithology identification from well logs, lithology interpretation from logs, lithology logging, lithology identification, lithology identification from well logs, lithology interpretation from logs, lithology logging, lithology identification, lithology identification from well logs, lithology interpretation from logs, lithology logging, lithology identification, lithology identification from well logs, lithology interpretation from logs, lithology logging, lithology identification, lithological logs, lithology identification from well logs, lithology interpretation from logs, lithology logging, lithology identification, lithology identification from well logs, lithology interpretation from logs, lithology logging, lithology identification, lithology identification from well logs, lithology interpretation from logs, lithology logging, lithology identification, lithology identification from well logs, lithology interpretation from logs, lithology logging, lithology identification, lithology identification from well logs, lithology interpretation from logs, lithology logging, lithology identification, lithology identification from well logs, lithology interpretation from logs, lithology identification, lithology logging, lithology identification from well logs, lithology interpretation from logs, lithology logging, lithology identification, lithology identification from well logs, lithology interpretation from logs, lithology logging, lithology identification, lithology identification from well logs, lithology interpretation from logs, lithology logging, lithology identification, lithological logs, Rock type determination, Formation evaluation, Log interpretation, Well logging techniques, Well log analysis, Borehole geophysics, Geophysical logs, Wireline logging, Well log data, Lithologic characterization, Log-based lithology, Well log interpretation, Lithological identification, Formation lithology, Logging tools, Geologic interpretation, Logging parameters, Well log response, Sedimentary rocks identification, Reservoir characterization, Stratigraphic interpretation, Log-derived lithology, Rock properties estimation
Figure 5: SP shifts due to formation water salinity changes

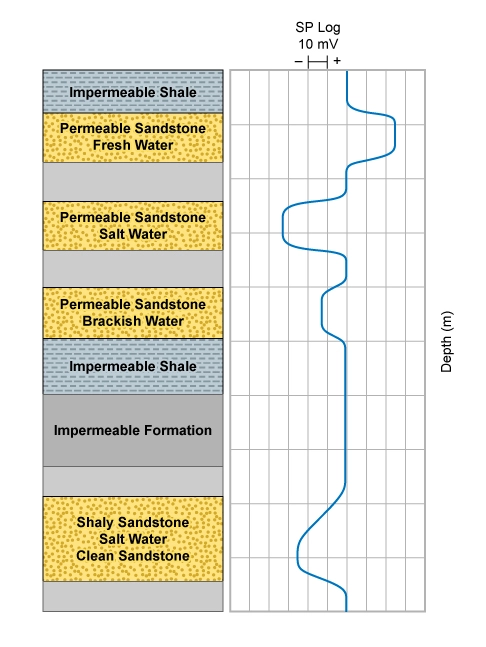
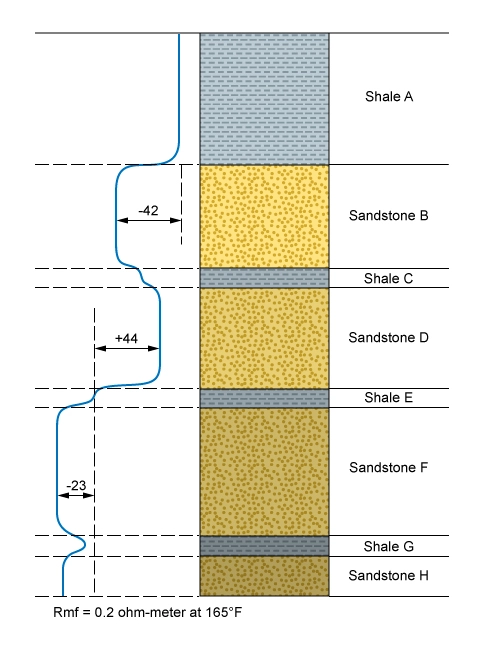
Figure 6 shows spontaneous potential log data through a series of stacked sandstones (B, D, F and H), separated by a number of thinner shales (C, E and G). The static SP (SSP) of sandstone B is -42 mV. Shale C is not a perfect cationic membrane, so the SP curve does not completely return to the shale baseline defined by shale A. A new shale baseline defined by shale E gives SP deflections of +44 mV in sandstone D and -23 mV in sandstone F.


Static spontaneous potential (SSP) shifts in a stacked sandstone sequence, lithology, lithology indicator, lithology log, lithology determination from well logs, types of well logging, how to identify pine logs, lithology identification from well logs, lithology interpretation from logs, lithology logging, lithology identification, lithology identification from well logs, lithology interpretation from logs, lithology logging, lithology identification, lithology identification from well logs, lithology interpretation from logs, lithology logging, lithology identification, lithology identification from well logs, lithology interpretation from logs, lithology logging, lithology identification, lithology identification from well logs, lithology interpretation from logs, lithology logging, lithology identification, lithological logs, lithology identification from well logs, lithology interpretation from logs, lithology logging, lithology identification, lithology identification from well logs, lithology interpretation from logs, lithology logging, lithology identification, lithological logs, lithology identification from well logs, lithology interpretation from logs, lithology logging, lithology identification, lithological logs, lithology identification from well logs, lithology interpretation from logs, lithology logging, lithology identification, lithological logs, lithology identification from well logs, lithology interpretation from logs, lithology logging, lithology identification, lithology identification from well logs, lithology interpretation from logs, lithology logging, lithology identification, lithology identification from well logs, lithology interpretation from logs, lithology logging, lithology identification, lithology identification from well logs, lithology interpretation from logs, lithology logging, lithology identification, lithology identification from well logs, lithology interpretation from logs, lithology logging, lithology identification, lithological logs, lithology identification from well logs, lithology interpretation from logs, lithology logging, lithology identification, lithology identification from well logs, lithology interpretation from logs, lithology logging, lithology identification, lithology identification from well logs, lithology interpretation from logs, lithology logging, lithology identification, lithology identification from well logs, lithology interpretation from logs, lithology logging, lithology identification, lithology identification from well logs, lithology interpretation from logs, lithology logging, lithology identification, lithology identification from well logs, lithology interpretation from logs, lithology identification, lithology logging, lithology identification from well logs, lithology interpretation from logs, lithology logging, lithology identification, lithology identification from well logs, lithology interpretation from logs, lithology logging, lithology identification, lithology identification from well logs, lithology interpretation from logs, lithology logging, lithology identification, lithological logs, Rock type determination, Formation evaluation, Log interpretation, Well logging techniques, Well log analysis, Borehole geophysics, Geophysical logs, Wireline logging, Well log data, Lithologic characterization, Log-based lithology, Well log interpretation, Lithological identification, Formation lithology, Logging tools, Geologic interpretation, Logging parameters, Well log response, Sedimentary rocks identification, Reservoir characterization, Stratigraphic interpretation, Log-derived lithology, Rock properties estimation
Figure 6: Static spontaneous potential (SSP) shifts in a stacked sandstone sequence

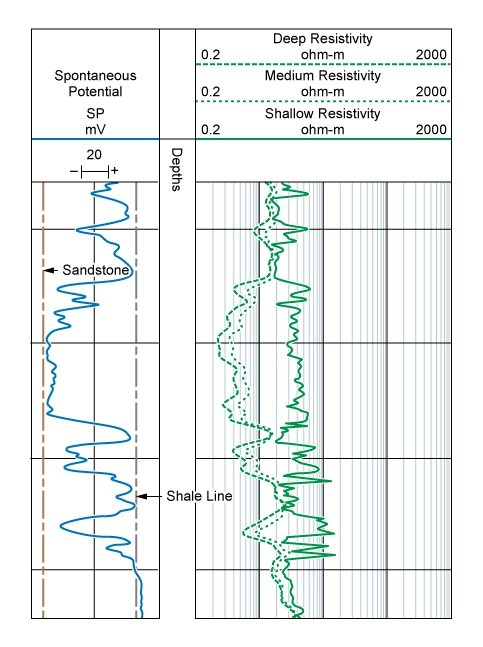
Adjacent to permeable formations, the SP curve departs from the shale baseline. In thick permeable beds, these excursions normally tend to reach a constant departure from the shale baseline (Figure 7), establishing the sandstone line. The SP deflection may be either to the left (by industry convention termed a negative deflection) or to the right (by convention termed a positive deflection), depending on the relative salinities of the formation water and the drilling mud filtrate. If the formation water salinity is greater than the drilling mud filtrate salinity, then the SP deflection is to the left. Low permeability rocks other than shale, such as tight sandstones and tight carbonates, will also result in low, or no, response on the SP curve because of no, or little, ion exchange. Changes in the wellbore diameter also have an effect on the SP response.

In thick permeable sandstone and dolomite beds, SP excursions reach a constant departure from the shale baseline, defining the sand line, lithology, lithology indicator, lithology log, lithology determination from well logs, types of well logging, how to identify pine logs, lithology identification from well logs, lithology interpretation from logs, lithology logging, lithology identification, lithology identification from well logs, lithology interpretation from logs, lithology logging, lithology identification, lithology identification from well logs, lithology interpretation from logs, lithology logging, lithology identification, lithology identification from well logs, lithology interpretation from logs, lithology logging, lithology identification, lithology identification from well logs, lithology interpretation from logs, lithology logging, lithology identification, lithological logs, lithology identification from well logs, lithology interpretation from logs, lithology logging, lithology identification, lithology identification from well logs, lithology interpretation from logs, lithology logging, lithology identification, lithological logs, lithology identification from well logs, lithology interpretation from logs, lithology logging, lithology identification, lithological logs, lithology identification from well logs, lithology interpretation from logs, lithology logging, lithology identification, lithological logs, lithology identification from well logs, lithology interpretation from logs, lithology logging, lithology identification, lithology identification from well logs, lithology interpretation from logs, lithology logging, lithology identification, lithology identification from well logs, lithology interpretation from logs, lithology logging, lithology identification, lithology identification from well logs, lithology interpretation from logs, lithology logging, lithology identification, lithology identification from well logs, lithology interpretation from logs, lithology logging, lithology identification, lithological logs, lithology identification from well logs, lithology interpretation from logs, lithology logging, lithology identification, lithology identification from well logs, lithology interpretation from logs, lithology logging, lithology identification, lithology identification from well logs, lithology interpretation from logs, lithology logging, lithology identification, lithology identification from well logs, lithology interpretation from logs, lithology logging, lithology identification, lithology identification from well logs, lithology interpretation from logs, lithology logging, lithology identification, lithology identification from well logs, lithology interpretation from logs, lithology identification, lithology logging, lithology identification from well logs, lithology interpretation from logs, lithology logging, lithology identification, lithology identification from well logs, lithology interpretation from logs, lithology logging, lithology identification, lithology identification from well logs, lithology interpretation from logs, lithology logging, lithology identification, lithological logs, Rock type determination, Formation evaluation, Log interpretation, Well logging techniques, Well log analysis, Borehole geophysics, Geophysical logs, Wireline logging, Well log data, Lithologic characterization, Log-based lithology, Well log interpretation, Lithological identification, Formation lithology, Logging tools, Geologic interpretation, Logging parameters, Well log response, Sedimentary rocks identification, Reservoir characterization, Stratigraphic interpretation, Log-derived lithology, Rock properties estimation
Figure 7: In thick permeable sandstone and dolomite beds, SP excursions reach a constant departure from the shale baseline, defining the sand line

If the drilling mud filtrate and the formation water have very different salinities, and consequently different densities, gravity-induced fluid migration can cause SP anomalies in highly permeable formations. Drilling mud filtrate invasion is very shallow near the lower boundary of each permeable interval and deeper near the upper boundary. The SP curve is rounded at the upper boundary because of the deep invasion, and it may have a sawtooth profile at thin, impervious shale streaks in which the SP deflection exceeds the SSP above the shale streak. A reading greater than the SSP is caused by the accumulation of filtrate below the shale streak. Encircling the hole is a horizontal disk of shale sandwiched between salt water and fresher mud filtrate that acts like a battery cell.

The presence of hydrocarbons of any phase will reduce the response of an SP log because the interstitial water contact with the wellbore fluid is reduced. This phenomenon is termed hydrocarbon suppression, and can occasionally be used to complement other techniques to diagnose rocks for commercial hydrocarbon potential. As any oil, gas or condensate present suppresses the SP response (Figure 8), a compensation for the pore fluid content is required when using the SP log as a lithology indicator.

Hydrocarbons suppressing the SP response, sp log, lithology indicator, lithology, lithology log, lithology determination from well logs, types of well logging, how to identify pine logs, lithology identification from well logs, lithology interpretation from logs, lithology logging, lithology identification, lithology identification from well logs, lithology interpretation from logs, lithology logging, lithology identification, lithology identification from well logs, lithology interpretation from logs, lithology logging, lithology identification, lithology identification from well logs, lithology interpretation from logs, lithology logging, lithology identification, lithology identification from well logs, lithology interpretation from logs, lithology logging, lithology identification, lithological logs, lithology identification from well logs, lithology interpretation from logs, lithology logging, lithology identification, lithology identification from well logs, lithology interpretation from logs, lithology logging, lithology identification, lithological logs, lithology identification from well logs, lithology interpretation from logs, lithology logging, lithology identification, lithological logs, lithology identification from well logs, lithology interpretation from logs, lithology logging, lithology identification, lithological logs, lithology identification from well logs, lithology interpretation from logs, lithology logging, lithology identification, lithology identification from well logs, lithology interpretation from logs, lithology logging, lithology identification, lithology identification from well logs, lithology interpretation from logs, lithology logging, lithology identification, lithology identification from well logs, lithology interpretation from logs, lithology logging, lithology identification, lithology identification from well logs, lithology interpretation from logs, lithology logging, lithology identification, lithological logs, lithology identification from well logs, lithology interpretation from logs, lithology logging, lithology identification, lithology identification from well logs, lithology interpretation from logs, lithology logging, lithology identification, lithology identification from well logs, lithology interpretation from logs, lithology logging, lithology identification, lithology identification from well logs, lithology interpretation from logs, lithology logging, lithology identification, lithology identification from well logs, lithology interpretation from logs, lithology logging, lithology identification, lithology identification from well logs, lithology interpretation from logs, lithology identification, lithology logging, lithology identification from well logs, lithology interpretation from logs, lithology logging, lithology identification, lithology identification from well logs, lithology interpretation from logs, lithology logging, lithology identification, lithology identification from well logs, lithology interpretation from logs, lithology logging, lithology identification, lithological logs, Rock type determination, Formation evaluation, Log interpretation, Well logging techniques, Well log analysis, Borehole geophysics, Geophysical logs, Wireline logging, Well log data, Lithologic characterization, Log-based lithology, Well log interpretation, Lithological identification, Formation lithology, Logging tools, Geologic interpretation, Logging parameters, Well log response, Sedimentary rocks identification, Reservoir characterization, Stratigraphic interpretation, Log-derived lithology, Rock properties estimation
Figure 8: Hydrocarbons suppressing the SP response

The significant features of the SP curve for petrophysical interpretation are its shape, and the size and direction of its departure from the shale baseline. The absolute reading and position of the shale baseline on the log are somewhat irrelevant because the SP sensitivity scale and shale baseline position are selected by each well’s logging engineer, using visual display criteria. If the resistivities of the mud filtrate and formation water are similar, the SP deflections are small and the SP curve is rather featureless. For this reason, the usefulness of SP varies with the salinity of wells drilled with water base drilling muds.

On offshore rigs, it is sometimes difficult to establish a good grounding for the surface electrode. This negates the log’s use as a lithology indicator. The offshore logging environment is well known for its various sources of electrical noise, such as wave motion, cathodic protection systems, rig welding, onboard generators and leaky power sources. A sine wave signal may be superimposed on the SP curve when some part of the wireline logging winch is magnetized. Intermittent contacts between the casing and the wireline cable armor may cause random and spurious spikes on the SP curve. In these situations, the SP curve can usually be interpreted after the sine wave amplitude or noise spikes have been separated from the authentic SP deflection.

An increasing number of wells have had their reservoir sections drilled with oil base muds in recent years, preventing the use of an SP log. More new LWD than wireline logs have been acquired worldwide since 2009. Consequently, the usage and significance of the SP log has declined in recent years as a lithology indicator. As many logging service companies do not specifically charge their customers incrementally for the SP curve, it is almost always recorded with wireline acquisition of resistivity logs whenever borehole conditions allow its operation. Often the gamma ray mimics the SP log response (Figure 9), and as it is largely unaffected by the type of drilling mud used, the gamma ray has been increasingly relied upon in preference to the SP as a shale volume and lithology indicator.


Gamma ray mimicking the SP response, lithology, lithology indicator, lithology log, lithology determination from well logs, types of well logging, how to identify pine logs, lithology identification from well logs, lithology interpretation from logs, lithology logging, lithology identification, lithology identification from well logs, lithology interpretation from logs, lithology logging, lithology identification, lithology identification from well logs, lithology interpretation from logs, lithology logging, lithology identification, lithology identification from well logs, lithology interpretation from logs, lithology logging, lithology identification, lithology identification from well logs, lithology interpretation from logs, lithology logging, lithology identification, lithological logs, lithology identification from well logs, lithology interpretation from logs, lithology logging, lithology identification, lithology identification from well logs, lithology interpretation from logs, lithology logging, lithology identification, lithological logs, lithology identification from well logs, lithology interpretation from logs, lithology logging, lithology identification, lithological logs, lithology identification from well logs, lithology interpretation from logs, lithology logging, lithology identification, lithological logs, lithology identification from well logs, lithology interpretation from logs, lithology logging, lithology identification, lithology identification from well logs, lithology interpretation from logs, lithology logging, lithology identification, lithology identification from well logs, lithology interpretation from logs, lithology logging, lithology identification, lithology identification from well logs, lithology interpretation from logs, lithology logging, lithology identification, lithology identification from well logs, lithology interpretation from logs, lithology logging, lithology identification, lithological logs, lithology identification from well logs, lithology interpretation from logs, lithology logging, lithology identification, lithology identification from well logs, lithology interpretation from logs, lithology logging, lithology identification, lithology identification from well logs, lithology interpretation from logs, lithology logging, lithology identification, lithology identification from well logs, lithology interpretation from logs, lithology logging, lithology identification, lithology identification from well logs, lithology interpretation from logs, lithology logging, lithology identification, lithology identification from well logs, lithology interpretation from logs, lithology identification, lithology logging, lithology identification from well logs, lithology interpretation from logs, lithology logging, lithology identification, lithology identification from well logs, lithology interpretation from logs, lithology logging, lithology identification, lithology identification from well logs, lithology interpretation from logs, lithology logging, lithology identification, lithological logs, Rock type determination, Formation evaluation, Log interpretation, Well logging techniques, Well log analysis, Borehole geophysics, Geophysical logs, Wireline logging, Well log data, Lithologic characterization, Log-based lithology, Well log interpretation, Lithological identification, Formation lithology, Logging tools, Geologic interpretation, Logging parameters, Well log response, Sedimentary rocks identification, Reservoir characterization, Stratigraphic interpretation, Log-derived lithology, Rock properties estimation
Figure 9: Gamma ray mimicking the SP response

Summary

The spontaneous potential (SP) log has an application for delineating, in a fairly gross sense, shale formations from shale-free, high permeability sandstone and carbonate formations, and defining the bed boundaries between such formations within a logged section. The slope of the SP curve is proportional to the intensity of the SP currents in the borehole at that depth. Because the current intensity is highest at the boundaries of the permeable formation, the slope of the SP curve is at a maximum, and an inflection point occurs at these bed boundaries.

The SP can also be used to determine the formation water resistivity, Rw, and for well to well correlations. It has limitations for determining the more subtle lithological boundaries and changes, which are much better resolved by higher vertical resolution dipmeter and borehole imaging logs. Care should be taken to account for any drift with depth in the SP shale baseline, and changes in the formation water salinities with depth in the well, as well as the effects of differing mud filtrate invasion, wellbore diameter changes and other anomalies. Compensation should be made for the suppressing effects of hydrocarbons on the SP response and in low permeability formations other than shale, such as tight sandstones and tight carbonates. As a consequence, deriving the formation lithology from an SP curve alone is not straightforward and requires a good understanding of, and corrections for, the various elements of the borehole environment for an effective interpretation.

Over the last several years, the increased usage of LWD data acquisition and oil base drilling muds, in which the SP log cannot work, and increased offshore drilling, where noise and grounding challenges make the SP log less reliable than in the onshore drilling environment, have decreased the previously significant usage of the SP log as a lithology indicator. Overall on new wells, it is now less used globally for lithology determination than the various natural gamma ray and density logs, porosity log crossplots, M-N and matrix identification (MID) crossplots and multi-mineral elemental analysis well log interpretation techniques for establishing the formation lithology from well logs. However, there remains a large number of SP logs in most companies’ databases, which can contribute to petrophysical and lithological studies.


Previous page 1 2 3 4 5 6 7 8Next page

Related Articles

Leave a Reply

Your email address will not be published. Required fields are marked *

ad
Back to top button