ad
DrillingPetrophysics
Trending

Cement Evaluation | Cement Evaluation Well Logging: Assessing Cement Integrity in Oil and Gas Wells

Acoustic Cement Bond Logs


Acoustic logging using a cement bond log (CBL) is the most widely used and efficient method for evaluating primary cement jobs. CBL uses a transmitter to send out short bursts of acoustic energy while multiple receivers positioned lower on the tool record the reflected energy. The manner in which the acoustic energy travels though the casing, cement, and formation indicates the quality of the cement bond at that point.

Meaningful interpretation of the logging results requires a detailed understanding of:

  • Wellbore and casing geometry and specifications
  • Comprehensive details of the cement job including event timing, pump pressures, and pump rates
  • Pre- and post-job well history

All CBLs must include a repeat section, a short log pass over about 200 feet of hole, recorded immediately prior to the main logging run and over a section that will be part of the main logging run. Both passes must occur under identical tool settings and downhole conditions. The repeat section verifies that the tool gives the same response under the same conditions.

It is important to note that a repeat section is not a tool “calibration,” although some in the industry refer to it as such. The tool’s performance is not being tested against a standard response as is done in a true calibration (such as with nuclear logging tools in an API standard test pit). A repeat section is only a “tool check” to make certain that the tool performs consistently.

Acoustic Properties of Cement and Formation Material

Sound waves travel differently at different velocities in different materials. Sound travels fastest in steel and slowest in fluids like drilling mud. Table 1 provides examples of the velocity of sound and acoustic impedance in a variety of cement and formation materials. While formation acoustic properties are set, cement properties change with time as the cement hardens. Similarly, the porosity of a formation will influence its acoustic properties. Taking into account these variables, it is possible to determine the quality of the interface between the cement and the casing and the cement and the formation.

MaterialsSound Velocity
(\tfrac{ft}{s})
Acoustic Impedance
(MRayl)
Steel (compression wave)19,54046.00
Water-saturated sandstone (porosity 5-20%)16,000 – 11,50012.58 – 8.20
Water-saturated limestone (porosity 5-20%)18,500 – 13,00014.83 – 9.43
Shale17,000 – 7,00012.0 – 4.3
15.8 ppg Class G cement (1 day)9,8425.68
15.8 ppg Class G cement (7 days)11,1556.44
12.51 ppg low-density cement system6,5623
15.4 ppg water-based mud4,6302.6
Table 1: Acoustic properties of downhole materials

The acoustic impedance of a material is defined as the product of its density and acoustic velocity. If acoustic velocity (expressed in \tfrac{m}{s}) and density (expressed in \tfrac{kg}{m^{3}}) are multiplied together the product is a Rayl. The S.I. unit of acoustic impedance is a MegaRayl or MRayl. Acoustic impedance is important in the determination of acoustic transmission and reflection at the boundary of two materials having different acoustic impedances, such as cement and steel.

Conventional CBL


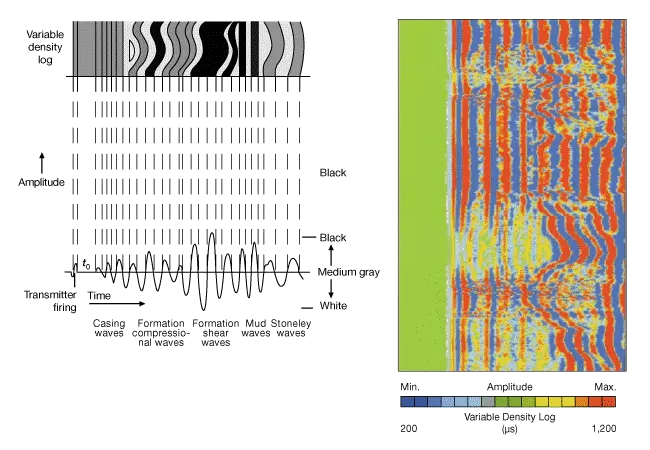
Figure 1 is a schematic diagram of a CBL tool and the associated sonic wave signals. When the acoustic transmitter repeatedly emits short bursts of acoustical energy, the receivers (generally two) pick up the signal. As the wave front leaves the transmitter it strikes the inside wall of the casing, and a portion is refracted down the pipe and picked up by the receivers. Some parts of the wave front travel directly through the mud, and some parts refract their way into the annulus and also the formation.

CBL schematic and wave profiles, CBL schematic, CBL, Conventional CBL, Cement Evaluation, cement evaluation tool, cement evaluation log, cement evaluation logging handbook, cement evaluation halliburton, cement evaluation technique, cement evaluation well logging, cement evaluation zonal isolation, cement bond valuation, ultrasonic cement evaluation, intex cement evaluation, cast cement evaluation, weatherford cement evaluation, usit cement evaluation, well cement evaluation, acoustic cement evaluation, cement quality grade, 43 grade cement list, how to check cement grade, how to check cement quality, how many test of cement, rockstrong cement 43 grade price, cement company valuation, cement company valuation india, evaluation concrete core test results, concrete damage evaluation, concrete evaluation equipment, cement logging handbook pdf, can cement steps be repaired, how many grades are there in cement, 43 grade cement specification, cement bond log evaluation, evaluation of cement industry, cement plant valuation, concrete pavement evaluation system, concrete pump evaluation, petrowiki cement evaluation, cement stock valuation, concrete surface evaluation, integrity explorer cement evaluation service, schlumberger cement evaluation, concrete evaluation tools, how to check ultratech cement grade, cement xrf, cement xrd
Figure 1: CBL schematic and wave profiles

The waveforms represented by the signals that arrive at the receivers after following these various paths are shown in Figure 1.

  • The mud wave has the shortest distance to travel but because of the relatively low sound velocity in fluids it arrives late.
  • The wave refracted directly down the casing usually arrives first.
  • The signal arriving at the receiver will be a composite of all of the waves.

Interpretation of the CBL relies on the casing signal arriving before any of the others.

The casing signal loses energy to the annulus and to the borehole due to the shear coupling with the adjacent material – the greater the amount of shear coupling, the greater the energy loss to the coupled material. The loss to the formation is low and constant, so the loss to the annulus is the variable.

The magnitude of this loss is represented by the amplitude or attenuation appearing on the log. If there is fluid in the annulus (not cement) there will be little attenuation of the casing signal. Even a microscopically-filled microannulus between the casing and the cement in the annulus will have a strong effect on the signal.

The most common way to present the information in the full waveform on the CBL is as a variable density log (VDL). The amplitude information is translated to density information, either in black-grey-white or color displays (Figure 2).

Full waveform signal from the CBL, waveform signal from the CBL, CBL, Conventional CBL, Cement Evaluation, Cement and Formation Material, Acoustic Properties, cement evaluation tool, cement evaluation log, cement evaluation logging handbook, cement evaluation halliburton, cement evaluation technique, cement evaluation well logging, cement evaluation zonal isolation, cement bond valuation, ultrasonic cement evaluation, intex cement evaluation, cast cement evaluation, weatherford cement evaluation, usit cement evaluation, well cement evaluation, acoustic cement evaluation, cement quality grade, 43 grade cement list, how to check cement grade, how to check cement quality, how many test of cement, rockstrong cement 43 grade price, cement company valuation, cement company valuation india, evaluation concrete core test results, concrete damage evaluation, concrete evaluation equipment, cement logging handbook pdf, can cement steps be repaired, how many grades are there in cement, 43 grade cement specification, cement bond log evaluation, evaluation of cement industry, cement plant valuation, concrete pavement evaluation system, concrete pump evaluation, petrowiki cement evaluation, cement stock valuation, concrete surface evaluation, integrity explorer cement evaluation service, schlumberger cement evaluation, concrete evaluation tools, how to check ultratech cement grade, cement xrf, cement xrd
Figure 2: Full waveform signal from the CBL

The CBL amplitude and VDL display is presented along a depth scale alongside a gamma ray (GR) and casing collar log (CCL) as shown in Figure 3.

CBL-VDL display, CBL and VDL, Conventional CBL, Cement Evaluation, cement evaluation tool, cement evaluation log, cement evaluation logging handbook, cement evaluation halliburton, cement evaluation technique, cement evaluation well logging, cement evaluation zonal isolation, cement bond valuation, ultrasonic cement evaluation, intex cement evaluation, cast cement evaluation, weatherford cement evaluation, usit cement evaluation, well cement evaluation, acoustic cement evaluation, cement quality grade, 43 grade cement list, how to check cement grade, how to check cement quality, how many test of cement, rockstrong cement 43 grade price, cement company valuation, cement company valuation india, evaluation concrete core test results, concrete damage evaluation, concrete evaluation equipment, cement logging handbook pdf, can cement steps be repaired, how many grades are there in cement, 43 grade cement specification, cement bond log evaluation, evaluation of cement industry, cement plant valuation, concrete pavement evaluation system, concrete pump evaluation, petrowiki cement evaluation, cement stock valuation, concrete surface evaluation, integrity explorer cement evaluation service, schlumberger cement evaluation, concrete evaluation tools, how to check ultratech cement grade, cement xrf, cement xrd
Figure 3: CBL-VDL display


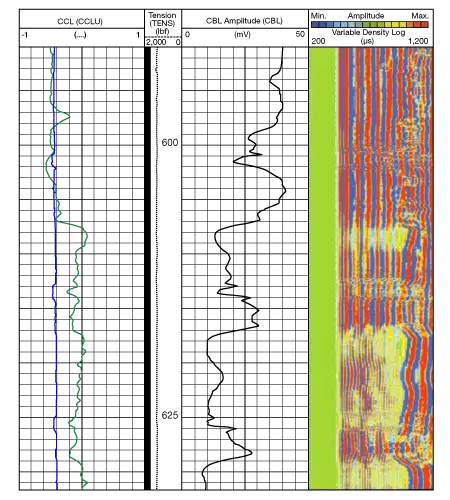
Analysis of a full waveform display gives qualitative information about the cement job. If the cement-to-casing bond is good, most of the sonic energy will leave the casing and pass into the cement and the casing waves will have low amplitude. The sonic energy will then propagate and attenuate through the formation, but because formations are not homogeneous, the formation arrivals will form wavy patterns. They represent a qualitative indication of a good coupling between cement and formation. The CBL-VDL display shown in Figure 3 illustrates a good cement job with good connection between cement and casing and cement and formation.

Certain situations can make interpretation more challenging. For example:

  • Contact between casing and formation: If eccentered casing is against the wellbore wall and uncemented, both casing and formation arrivals can look like a well-cemented casing.
  • Unconsolidated formations: Unconsolidated formations attenuate the sound waves and the VDL will not show any formation waves because their amplitude will be too low.
  • Fast formations: In very hard, lower porosity rock where sound travels faster than along the casing, the wavy pattern on the VDL is seen earlier than the casing arrivals.
  • Salt intervals: Highly plastic and with very little heterogeneity, in these formations the VDL is very regular and sometimes appears similar to that of free, uncemented pipe.
  • Microannulus: Extremely small space between casing and cement can appear as poor cement job, even though it is not. Pressuring up on casing and re-running the CBL can reveal whether this is the case (Figure 4). If this does not remove the indication of a poor cement bond, there could be a channel or a large enough microannulus that communication could be a problem and zonal isolation is not possible.
CBL-VDL display showing evidence of microannulus and elimination after pressurization of casing, CBL, VDL, Cement Evaluation, Acoustic Properties, Microannulus, Fast formations, Unconsolidated formations, Contact between casing and formation, cement evaluation tool, cement evaluation log, cement evaluation logging handbook, cement evaluation halliburton, cement evaluation technique, cement evaluation well logging, cement evaluation zonal isolation, cement bond valuation, ultrasonic cement evaluation, intex cement evaluation, cast cement evaluation, weatherford cement evaluation, usit cement evaluation, well cement evaluation, acoustic cement evaluation, cement quality grade, 43 grade cement list, how to check cement grade, how to check cement quality, how many test of cement, rockstrong cement 43 grade price, cement company valuation, cement company valuation india, evaluation concrete core test results, concrete damage evaluation, concrete evaluation equipment, cement logging handbook pdf, can cement steps be repaired, how many grades are there in cement, 43 grade cement specification, cement bond log evaluation, evaluation of cement industry, cement plant valuation, concrete pavement evaluation system, concrete pump evaluation, petrowiki cement evaluation, cement stock valuation, concrete surface evaluation, integrity explorer cement evaluation service, schlumberger cement evaluation, concrete evaluation tools, how to check ultratech cement grade, cement xrf, cement xrd
Figure 4: CBL-VDL display showing evidence of a microannulus (left) and its elimination after pressurization of the casing (right)
CBL and VDL, CBL and VDL Evaluation, Cement Evaluation, CBL-VDL display showing the effect of a fast formation, Fast formations, cement evaluation tool, cement evaluation log, cement evaluation logging handbook, cement evaluation halliburton, cement evaluation technique, cement evaluation well logging, cement evaluation zonal isolation, cement bond valuation, ultrasonic cement evaluation, intex cement evaluation, cast cement evaluation, weatherford cement evaluation, usit cement evaluation, well cement evaluation, acoustic cement evaluation, cement quality grade, 43 grade cement list, how to check cement grade, how to check cement quality, how many test of cement, rockstrong cement 43 grade price, cement company valuation, cement company valuation india, evaluation concrete core test results, concrete damage evaluation, concrete evaluation equipment, cement logging handbook pdf, can cement steps be repaired, how many grades are there in cement, 43 grade cement specification, cement bond log evaluation, evaluation of cement industry, cement plant valuation, concrete pavement evaluation system, concrete pump evaluation, petrowiki cement evaluation, cement stock valuation, concrete surface evaluation, integrity explorer cement evaluation service, schlumberger cement evaluation, concrete evaluation tools, how to check ultratech cement grade, cement xrf, cement xrd
Figure 5: CBL-VDL display showing the effect of a fast formation


  • The top of this example shows free pipe from the upper portion of the well (straight parallel bands).
  • The chevron patterns indicate diffraction caused by the casing collar.
  • The amplitude curve is high and steady in the free pipe section, with a “kick” at the collar.
  • The wavy formation patterns show that some solid material is present at spots in the annulus.
  • The lower portion of the log shows variable amplitude, but the high amplitudes are caused by fast formations, not lack of cement.
  • The VDL display confirms fast formation where the first formation arrival occurs earlier than the casing arrival (*). Amplitude measurement in a fast formation is not indicative of cement bond quality.

Pad-type Sonic Tools

Sonic cement evaluation tools with multiple transmitters and receivers mounted on pads that are kept in contact with the casing wall, provide a three dimensional measurement of the bond formation. Such tools mitigate the problems that stem from a CBL being eccentered in the casing and also from hole fluid effects.

A transducer arrangement of receivers and transmitters is mounted on each pad. Each pad permits the rate of attenuation to be computed across a segment of the casing circumference. A high rate of attenuation indicates good cement bonding to the casing and an absence of channels within the cement. The bonding between cement and formation is investigated through a CBL-type receiver array run simultaneously.

Figure 6 shows a log from the Baker Atlas Segmented Bond Tool (SBT).

  • Track 1: Gamma ray and two log quality curves (pad contact with the borehole wall and centralization).
  • Track 2: Acoustic attenuation logs for each of six pads.
  • Track 3: Average and minimum attenuation at each sampling level.
  • Track 4: Variable-attenuation log or “cement map” of the casing periphery vs. depth. Dark zones are the most strongly bonded and white indicates a lack of cement bond.
  • Track 5: CBL-type display. In this example, the partial bonding is sufficient to provide hydraulic isolation.

There is poor cement condition between X688 and X714 depth units.

Baker Atlas Segmented Bond Tool, Baker Atlas SBT, Cement Evaluation, cement evaluation tool, cement evaluation log, cement evaluation logging handbook, cement evaluation halliburton, cement evaluation technique, cement evaluation well logging, cement evaluation zonal isolation, cement bond valuation, ultrasonic cement evaluation, intex cement evaluation, cast cement evaluation, weatherford cement evaluation, usit cement evaluation, well cement evaluation, acoustic cement evaluation, cement quality grade, 43 grade cement list, how to check cement grade, how to check cement quality, how many test of cement, rockstrong cement 43 grade price, cement company valuation, cement company valuation india, evaluation concrete core test results, concrete damage evaluation, concrete evaluation equipment, cement logging handbook pdf, can cement steps be repaired, how many grades are there in cement, 43 grade cement specification, cement bond log evaluation, evaluation of cement industry, cement plant valuation, concrete pavement evaluation system, concrete pump evaluation, petrowiki cement evaluation, cement stock valuation, concrete surface evaluation, integrity explorer cement evaluation service, schlumberger cement evaluation, concrete evaluation tools, how to check ultratech cement grade, cement xrf, cement xrd
Figure 6: Baker Atlas SBT display showing a poorly cemented section between X688 and X714

Ultrasonic Cement Evaluation

Ultrasonic cement evaluation tools make a small portion of the casing resonate by transmitting a low to medium frequency broadband pulse (200 to 700 kHz) normal to the casing wall.

Ultrasonic tools are less sensitive to the presence of a fluid-filled microannulus between pipe and cement and also provides better 360 degree resolution. However, ultrasonic tools are sensitive to pipe roughness (such as corrosion) and their performance can be reduced in heavy muds or oil based muds.

The transducer sends out a short pulse of ultrasound and listens for the echo. Fluid behind the casing will “ring” like a bell. If there is a good connection between the casing and solid cement behind it, the resonance is dampened. Thus, the tool measures the acoustic impedance of the material behind the casing from the nature of the resonance.

The presentation of results for an ultrasonic cement evaluation can vary by service company. Typically, they show a variety of ultrasonic measurements related to the timing of the echoes (Figure 7). These include the internal casing condition, the internal radius of the casing, the casing thickness, and the cement impedance.

Ultrasonic cement evaluation tool, Ultrasonic cement evaluation, Ultrasonic cement evaluation tool measurements, Cement Evaluation, cement evaluation tool, cement evaluation log, cement evaluation logging handbook, cement evaluation halliburton, cement evaluation technique, cement evaluation well logging, cement evaluation zonal isolation, cement bond valuation, ultrasonic cement evaluation, intex cement evaluation, cast cement evaluation, weatherford cement evaluation, usit cement evaluation, well cement evaluation, acoustic cement evaluation, cement quality grade, 43 grade cement list, how to check cement grade, how to check cement quality, how many test of cement, rockstrong cement 43 grade price, cement company valuation, cement company valuation india, evaluation concrete core test results, concrete damage evaluation, concrete evaluation equipment, cement logging handbook pdf, can cement steps be repaired, how many grades are there in cement, 43 grade cement specification, cement bond log evaluation, evaluation of cement industry, cement plant valuation, concrete pavement evaluation system, concrete pump evaluation, petrowiki cement evaluation, cement stock valuation, concrete surface evaluation, integrity explorer cement evaluation service, schlumberger cement evaluation, concrete evaluation tools, how to check ultratech cement grade, cement xrf, cement xrd
Figure 7: Ultrasonic cement evaluation tool measurements


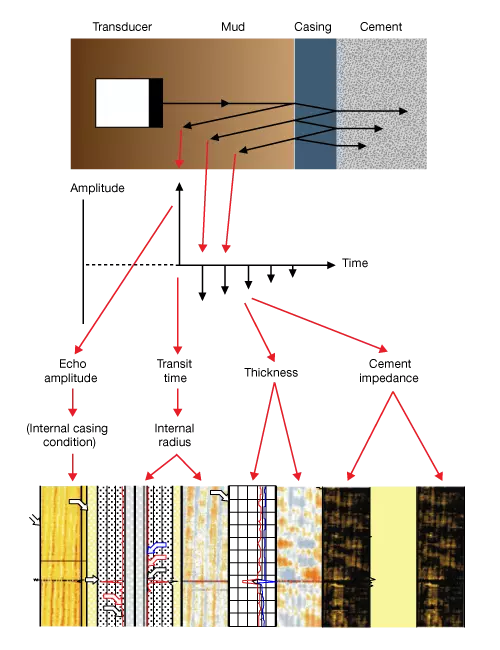
Figure 8 shows an example of an ultrasonic log through a well-cemented casing. The acoustic impedance measurement in track 3 reveals an average impedance of 8 MRayl for the cement that is all around the casing. The accompanying CBL amplitude is low, and the VDL shows a weak casing arrival and a strong formation arrival, all indications of a good cement job.

Ultrasonic and CBL-VDL log, Ultrasonic cement evaluation, Cement evaluation, Ultrasonic and CBL-VDL log over a well-cemented interval, cement evaluation tool, cement evaluation log, cement evaluation logging handbook, cement evaluation halliburton, cement evaluation technique, cement evaluation well logging, cement evaluation zonal isolation, cement bond valuation, ultrasonic cement evaluation, intex cement evaluation, cast cement evaluation, weatherford cement evaluation, usit cement evaluation, well cement evaluation, acoustic cement evaluation, cement quality grade, 43 grade cement list, how to check cement grade, how to check cement quality, how many test of cement, rockstrong cement 43 grade price, cement company valuation, cement company valuation india, evaluation concrete core test results, concrete damage evaluation, concrete evaluation equipment, cement logging handbook pdf, can cement steps be repaired, how many grades are there in cement, 43 grade cement specification, cement bond log evaluation, evaluation of cement industry, cement plant valuation, concrete pavement evaluation system, concrete pump evaluation, petrowiki cement evaluation, cement stock valuation, concrete surface evaluation, integrity explorer cement evaluation service, schlumberger cement evaluation, concrete evaluation tools, how to check ultratech cement grade, cement xrf, cement xrd
Figure 8: Ultrasonic and CBL-VDL log over a well-cemented interval

Figure 9 shows an example of an ultrasonic log through a section of casing with a wide (about half of the casing circumference) mud channel behind the pipe. The lighter brown color in the ultrasonic track consistent with an impedance of only about 5 MRayl indicates mud contaminated cement, and the channel is indicated by the wide blue swath. The CBL-VDL log is consistent with the ultrasonic log, showing a strong casing arrival and a weak formation arrival and a high and variable amplitude. However, the CBL-VDL alone would not provide an unambiguous indicator of a poorly cemented interval.

Ultrasonic cement evaluation, Ultrasonic cement evaluation log, CBL-VDL, cement evaluation, cement evaluation log, cement evaluation tool, cement evaluation log, cement evaluation logging handbook, cement evaluation halliburton, cement evaluation technique, cement evaluation well logging, cement evaluation zonal isolation, cement bond valuation, ultrasonic cement evaluation, intex cement evaluation, cast cement evaluation, weatherford cement evaluation, usit cement evaluation, well cement evaluation, acoustic cement evaluation, cement quality grade, 43 grade cement list, how to check cement grade, how to check cement quality, how many test of cement, rockstrong cement 43 grade price, cement company valuation, cement company valuation india, evaluation concrete core test results, concrete damage evaluation, concrete evaluation equipment, cement logging handbook pdf, can cement steps be repaired, how many grades are there in cement, 43 grade cement specification, cement bond log evaluation, evaluation of cement industry, cement plant valuation, concrete pavement evaluation system, concrete pump evaluation, petrowiki cement evaluation, cement stock valuation, concrete surface evaluation, integrity explorer cement evaluation service, schlumberger cement evaluation, concrete evaluation tools, how to check ultratech cement grade, cement xrf, cement xrd
Figure 9: Ultrasonic cement evaluation log, with CBL-VDL, across an interval with a mud channel behind the casing and mud contaminated cement

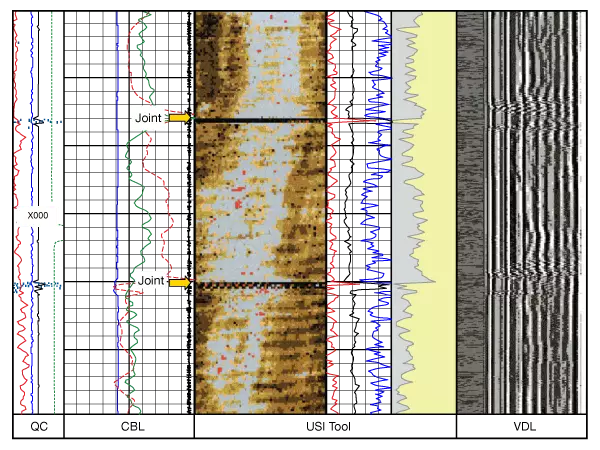
A combined Ultrasonic-CBL-VDL log provides a much more complete picture of the wells zonal isolation condition and removes some of the ambiguity present when only a CBL-VDL is available.

Table 2 provides a guide for which tool provides better information depending on specific conditions. A combination of both can be used to address practically any situation.

ConditionUltrasonicCBL-VDL
Resolution1.2 inch3 feet, 360 degrees
GasGas (0 Mrayl)Higher amplitude than free pipe
LiquidLiquid (1-3 MRayl)Free pipe
Well-bonded cementCement (4-8 MRayl)Good bond
Very light cementLow contrast from liquidLow contrast from liquid
Liquid-filled microannulusMedium impedance cementPoor bond indicated but ambiguous; pressure pass needed to confirm
Contaminated cementLow impedance cementFair bond (ambiguous)
Mud channel behind pipeChannel indicatedFair bond (ambiguous)
Narrow gas channelGas channel indicatedCement
Cement-formation bondNot seenVDL qualitative indication
Reflections from hard formationSlightly affected (interference patterns)Strongly affected (poor bond indicated)
Casing conditionVery sensitiveSlightly sensitive
Heavy mudsLimit of <16 \tfrac{lbm}{gal} for water based mud and <13 \tfrac{lbm}{gal} for oil based mudNo limit
Table 2: Comparison of tools for various conditions


Previous page 1 2 3 4Next page

Related Articles

Leave a Reply

Your email address will not be published. Required fields are marked *

ad
Back to top button