Stratigraphic basin analysis models are used to interpret the sedimentary history of a basin by examining the distribution and character of its sedimentary rocks. These models help geologists understand the depositional environment, source of sediment, and the tectonic and climatic events that have shaped the basin over time.
Introduction
The primary purpose of stratigraphic modeling in sedimentary basins is to predict the distribution of siliciclastic and carbonate lithologies. This is especially important in frontier basins where seismic data and well control are limited. The foundation for modern stratigraphic modeling is the concept of sequence stratigraphy, developed by P. R. Vail and his colleagues at Exxon Production Research Company during the late 1960s and middle 1970s.
Sequence Stratigraphic Models
Depositional sequences are defined as packages of genetically related units bounded by stratigraphic discontinuities (unconformities) and their correlative conformities (Mitchum, 1977). Depositional sequences (Figure 1)
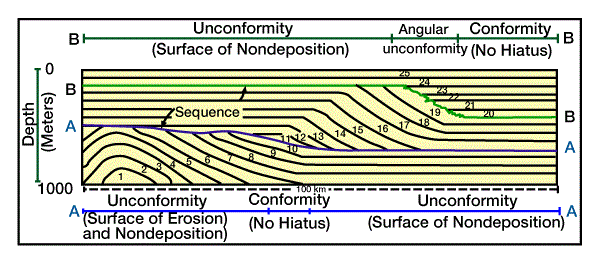
and Figure 2 have a chronostratigraphic significance because they are deposited during a time interval limited by the ages of the sequence boundaries where they are conformities.
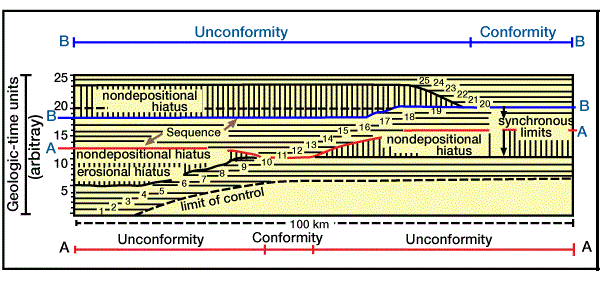
Each depositional sequence has its “own particular regional distribution, stratal geometry, thickness pattern, and geologic history”, and is deposited during one cycle of rise and fall in sea level.
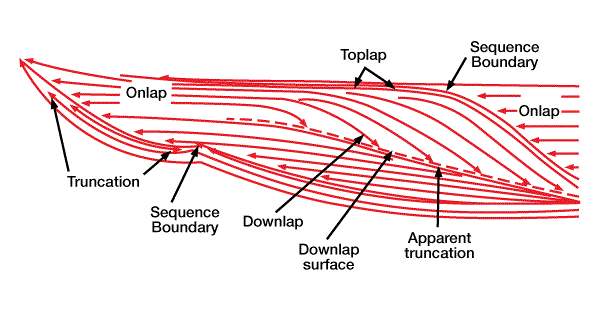
Anstey (1992) discusses the general principles of sequence identification and lithologic prediction based on sequence models. Anstey begins with a reprise of the basic techniques for defining sequence boundaries (Figure 3).
in a simple shelfal system (Figure 4),
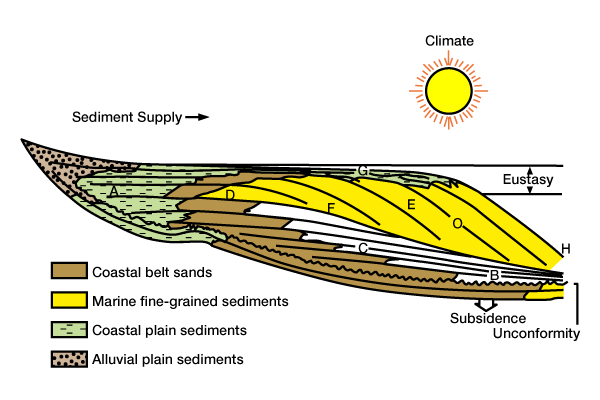
and then leads the reader step by step through the sequence stratigraphic analysis of a more complex shelfal system (Figure 5).
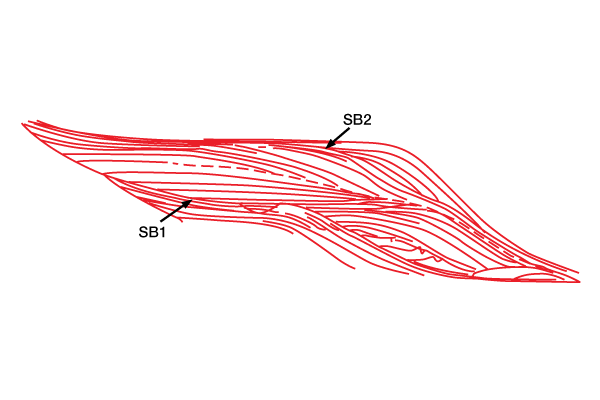
The sequence analyzed in Figure 5 lies between SB1 and SB2; each of the unconformities (and their correlative conformities) represents a period of relative sea-level lowstand. Figure 6 shows the elements affecting relative sea level, and the expected locations of sequence boundaries SB1 and SB2.
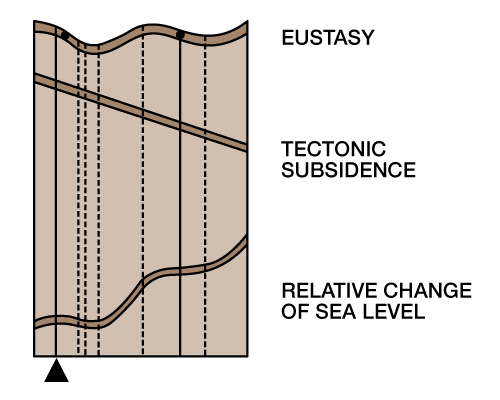
Anstey breaks the sequence down into separate systems tracts, each composed of sediments deposited in linked depositional systems during the different phases of sea level fall and rise that produce a sequence. He presents a series of three-dimensional models, keyed to the relative sea-level chart, which illustrate the key components of the separate systems tracts. For example, Figure 7,
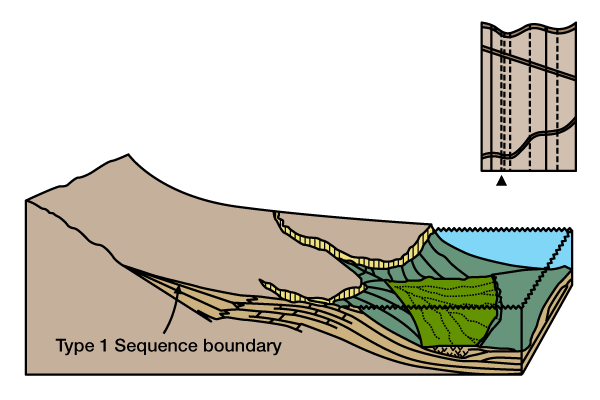
Figure 8,

and Figure 9 show the three components of the lowstand systems tract,

and Figure 10
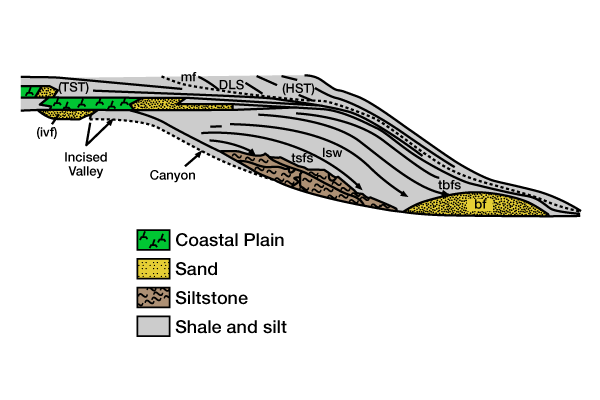
and Figure 11 are summaries of the types of sediment and reservoir potential predicted in the lowstand systems tract.
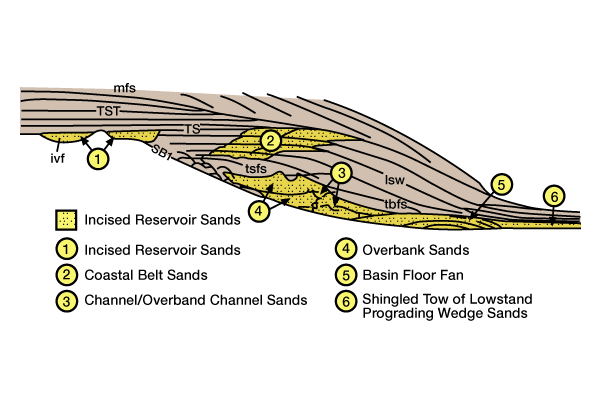
Anstey continues with models of the transgressive systems tract, highstand systems tract, and shelf margin systems tract, and builds a complete sequence analysis of the various tracts that comprise an ideal sequence. Figure 12 summarizes these tracts relative to the sea-level curve,

and Figure 13

and Figure 14

FIGURE 14
show the stratal patterns of Figure 5 interpreted in terms of likely rock type for a clastic system.
 Petro Shine The Place for Oil and Gas Professionals.


