Related Articles


Petrographic Studies
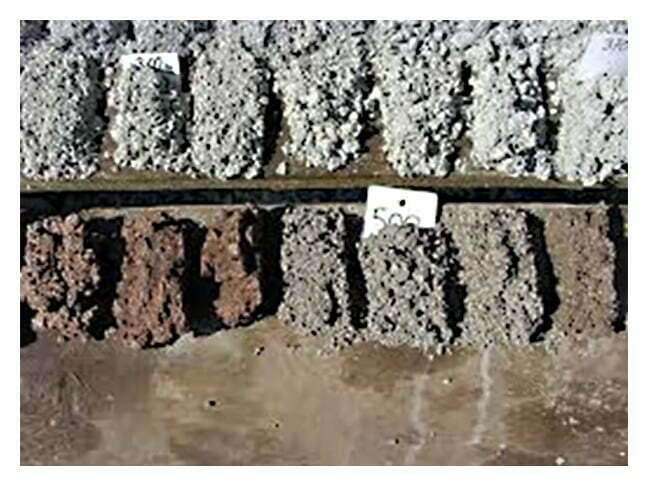
Petrography is a branch of petrology that focuses on the detailed descriptions of rocks. Sidewall cores and conventional cores, as well as ditch cuttings the cuttings of rock (Figure 1) brought to the surface by the circulating drilling medium (normally a drilling mud) recovered from wells can be used for petrographic studies. The mineral content and the textural relationships within the rock are described in detail.
Progress in instrumentation now allows the core analysts to look into the pore spaces and examine samples at magnifications of 50,000 times or greater. These various microscopic measurements are complementary in nature, and all may be made on a single sample that is representative of a given depth.
Figure 2 shows several types of microscopes that may be used in petrographic studies.

Petrographic studies include thin section analysis, scanning electron microscopy (SEM), X-ray diffraction and cathodoluminescence.
Thin Section Analysis
In thin section analysis, samples are mounted on glass and ground to a uniform thickness of 0.03 mm. They are studied with a petrographic microscope under both normal and polarized light (Figure 3). The minerals that are present are identified, and the estimated porosity, median grain diameter, and the degree of rounding and sorting are recorded. The accumulation of minerals can be ascertained, and the changes in composition, texture and cementation that have occurred after deposition can be determined. These studies use magnifications of up to 600 times normal size.
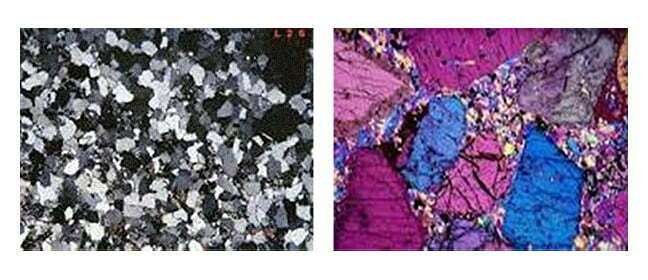
Thin section analysis is a less successful method for identifying clays, but there may be cases where a particular clay is abundant enough to be seen and identified (Figure 4).

An example of the core description made from this type of analysis might be:
- Sample depth: 4640 feet
- Color: Medium gray
- Name: Fine-grained sandstone
- Sorting: Well
- Lithification: Well
- Texture: Massive
- Grain size:
- Minimum: 0.06 mm
- Maximum: 0.51 mm
- Average: 0.24 mm
- Angularity and shape: Angular to sub rounded
- Grain contacts: Concavo-convex
Table 1 displays an example of thin section data.
| Table 1: Thin Section Data | |||
|---|---|---|---|
| Detrital grains(%) | Cements(%) | Matrix(%) | Visible porosity(%) |
| Quartz: 69 | Secondary | Detrital: 2 | Intergranular: 5 |
| Chert: 3 | Quartz | Authigenic: 4 | Grain-moldic: 2 |
| Alkali Feldspar: 1 | Secondary Quartz Overgrowths: 7 | Dissolution: 1 | |
| Plagioclase Feldspar: 1 | Calcite: — | Microporosity: 1 | |
| Lithic Fragments: 4 | Pyrite: Trace | Fracture: — | |
Scanning Electron Microscopy (SEM)
Scanning electron microscope photographs provide a three-dimensional view of a pore space with a magnification of up to approximately 40,000 times normal. Both the distribution and the morphology of clays within the pore spaces can be studied with this type of display. Normally, samples for analysis are first coated with a thin film of conductive material and then bombarded with electrons. This causes a secondary electron emission that yields a visual image, such as that shown in Figure 5, plus X-ray photons that are then available for elemental analysis.
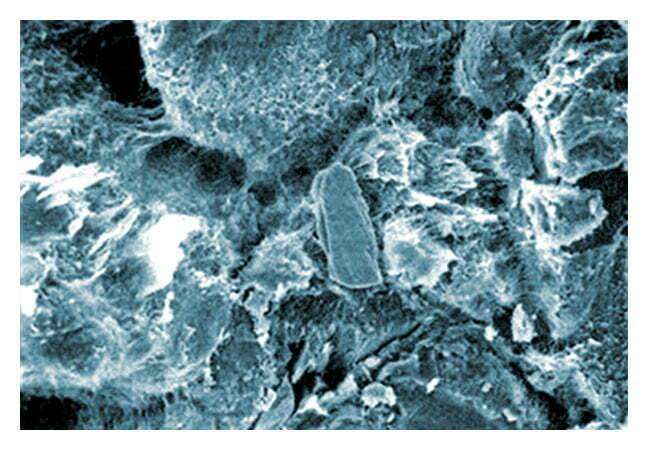
The elemental analysis assists in defining the clay type and chemistry. Clays influence core analysis procedures, permeability and porosity magnitude, well completion techniques and the responses of the downhole LWD and wireline logs. The ability to identify clay types and to observe the microporosity present in both clay linings and in carbonates are two of the most important uses of SEM information.
X-ray Diffraction
All crystalline materials reflect X-rays from atomic planes within the crystal that generate a unique diffraction pattern. This allows the identification of minerals, including those too small to be identified by thin section studies. Improved clay mineral identification results when clay-sized particles of four microns or less are separated from large sand grain particles and X-rayed as a unit. Table 2 is an example of such data.
| Table 2: X-ray Diffraction Data | |||
|---|---|---|---|
| Mineral | Bulk sample | Net clay fraction (4.2% of bulk sample) | |
| Sample depth: 4640 ft. | |||
| Quartz | 91 | ||
| Feldspars | 5 | ||
| Calcite | — | ||
| Kaolinite | 3 | 70 | |
| Chlorite | — | — | |
| Illite/Mica | 1 | 30 | |
| Total | 100% | 100% | |
Cathodoluminescence
Thin sections of rock that are placed within a vacuum chamber will glow with color when hit with electrons. If the electron emitter is mounted on a petrographic microscope, immediate comparison of samples by polarized light and luminescence is possible, and growth rings similar to those of trees may be observed in individual crystals. Some authors suggest that these rings have proved to be correlatable over large distances, and that their color pattern reflects trace elements present in formation waters at various stages of the crystal history. The color pattern, then, offers insight into water temperature and chemistry during the history of the rocks. Tung-Hau et al. (2012) investigated the controlled growth density and patterning of silica nanorings and nanowires with enhanced ultraviolet cathodoluminescence peak. Alimuddin et al. (2011) discussed hydrocarbon and mineral exploration using cathodoluminescence.
Doane et al. (1995) noted the use of a combination of petrographic and special core analysis techniques to evaluate the potential effectiveness of proposed drilling fluids and procedures, prior to the actual cost and risk of implementation. This minimizes invasive formation damage of a mechanical, chemical or biological nature during the subsequent drilling of wells.
