Related Articles


Water Saturation versus Height
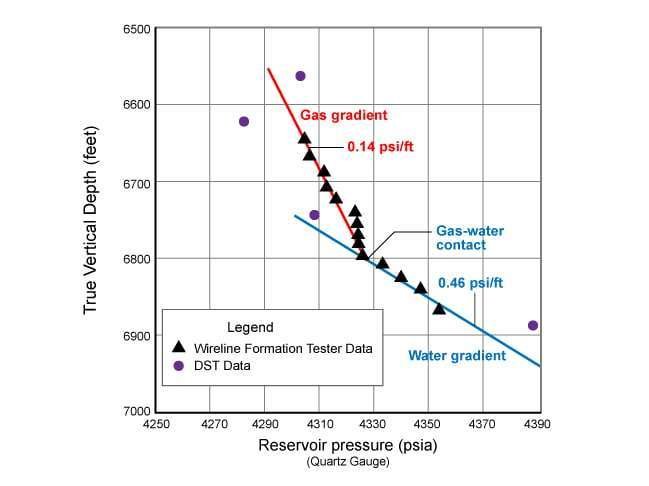
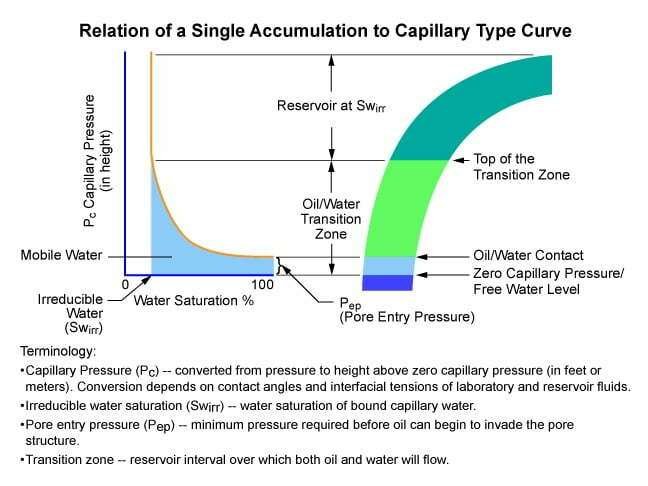
The laboratory measured capillary pressure can be corrected to an equivalent height above the free water level in the reservoir. The free water level is defined as the depth where the capillary pressure is zero. For practical purposes, it is the depth at which a high permeability and high porosity reservoir rock would show no residual oil saturation as the zone of 100% water saturation is approached. The zero capillary pressure point in the reservoir is at the intersection of the oil and water continuous phase pressure lines on a pressure versus vertical depth plot derived from vertically distributed wireline formation pressure points (Figure 1). Figure 2 shows a schematic relationship between a capillary pressure curve and oil accumulation.
The equations used to correct the laboratory measured capillary pressure to an equivalent height above the free water level in the reservoir require knowledge of the interfacial tension of the fluids, both in the laboratory and in the reservoir. Some estimate must also be made of the contact angle in the reservoir. For water-wet systems, the values reported in Table 1 may be used as an approximation for those two variables if no further information is available.
| Table 1. Typical Interfacial Tension and Contact Angle Values for a Water-wet System | |||||
|---|---|---|---|---|---|
| System | Contact angle, | |Cosine | Interfacial Tension, T | T | |
| Laboratory | Air-water | 0 | 1.0 | 72 | 72 |
| Oil-water | 30 | 0.866 | 48 | 42 | |
| Air-mercury | 140 | 0.765 | 480 | 367 | |
| Air-oil | 0 | 1.0 | 24 | 24 | |
| Reservoir | Water-oil | 30 | 0.866 | 30 | 26 |
| Water-gas | 0 | 1.0 | 50 | 50 | |

or

But

Therefore

Where:
 = height above free water table
 = capillary pressure
 = interfacial tension
 = contact angle
 = density of brine
 = density of hydrocarbon
 = gravity term used to convert density to fluid gradient
 = subscript used to indicate initial reservoir conditions
 = subscript used to indicate laboratory conditions
Schowalter (1976) discusses the importance of capillary pressure and presents data that may be used for estimating the parameters required in the three equations. Examples of conversions of capillary pressure to reservoir height have also been presented by Keelan in the manual published by Core Laboratories, Inc., Special Core Analysis.
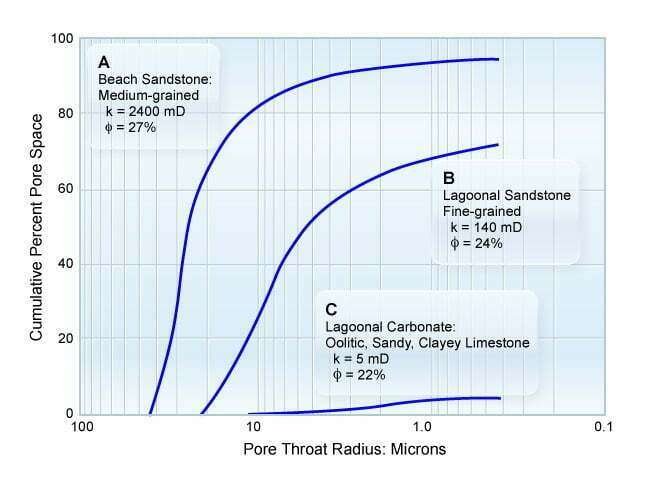
Pore Throat Distribution
Capillary pressure data obtained from mercury injection tests can be converted to equivalent pore radii. Figure 3 illustrates plots of the pore entry radius developed from capillary pressure curves. These data have been helpful in rock typing and in the selection of net pay.