Related Articles


Dispersed Shale Model
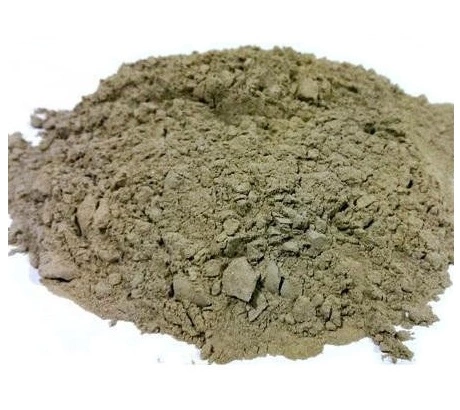
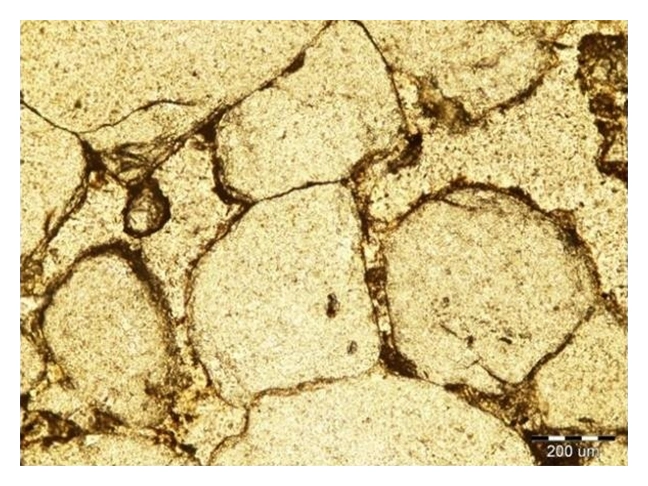
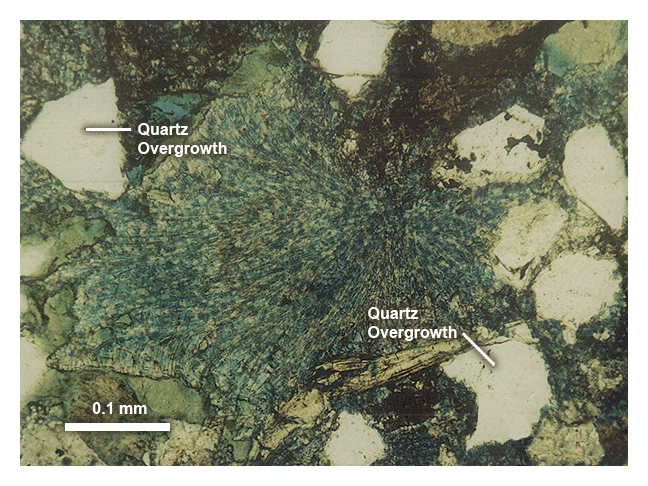
The dispersed shale model has the premise that clay fines and clay overgrowths on the sand grains of a sandstone formation progressively replace the pore spaces in increasing quantities. Clay overgrowth structures are frequently formed during the early stages of diagenesis of the formation rocks. Often the chemical composition of the overgrowths around clay minerals, such as illite and smectite, respond to the changing subsurface environment, implying an addition of silica in a predominantly sandstone formation (Steinberg et al., 1987). See Figure 1, Figure 2, and Figure 3.
Clay fines and overgrowths both have very high surface areas on which large quantities of water are absorbed. Thus, erroneously high water saturations are likely to be calculated if the basic Archie equation (a well log analysis model applicable only for shale-free formations) were to be used to calculate the water saturation. Consequently, alternative log analysis methods and equations must be used to evaluate sandstone reservoirs containing dispersed shales.
Figure 4 illustrates schematically how the dispersed clays progressively replace porosity in a conventional resource sandstone reservoir.
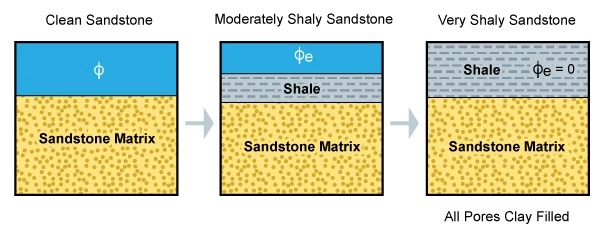
The maximum possible value of the proportion of the dispersed clays, Vdis, is that equivalent to the original porosity, in the case of the complete porosity replacement by dispersed shale. However, the actual volume of sandstone matrix material always remains unchanged.
Porosity
In the dispersed shale model, the porosity measured by the density log, ϕD, is expressed by the equation:

The porosity measured by the neutron porosity log, ϕN, is:

Where:
ϕNsh= apparent neutron porosity in the shale
Vdis= volume of the dispersed shale within the logged interval expressed as a decimal
ϕe= true porosity in the clean sandstone
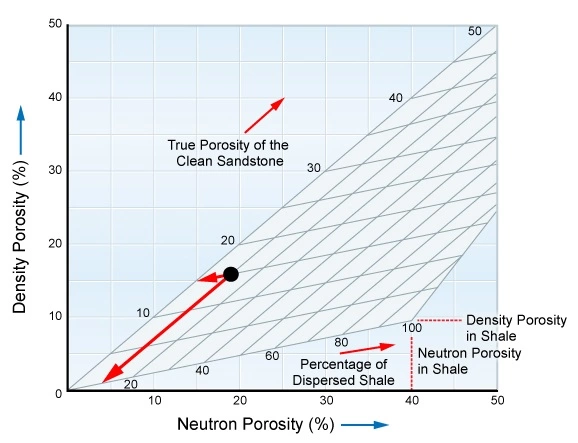
By combining these two equations, an expression for the true porosity can be established:

and

This is represented graphically in Figure 5 for the situation where:
- Density porosity = 16%
- Neutron porosity = 19%
- Neutron porosity in shale = 40%
- Density porosity in shale = 10%
In this case, the true porosity of the clean sandstone is determined to be 15% and the proportion of dispersed shale is determined to be 10%.
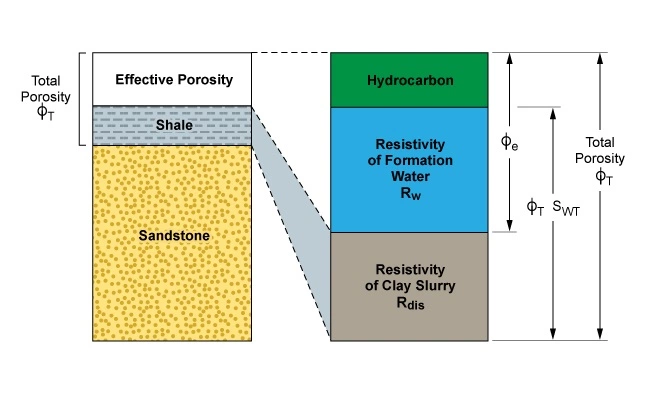
The electrical model of the dispersed clay system assumes the total porosity, ϕT, to be filled with a mixture of clay slurry of resistivity, Rdis, free formation water of resistivity, Rw, and hydrocarbons, if any are present. Thus the total formation conductivity is considered to be the sum of an Archie term referred to as the total porosity—both the freely interconnected pores and the clay slurry-filled pores—and a clay conductivity term that depends both on water saturation and the clay fraction. Figure 6 schematically shows this electrical model.
Water Saturation
For the dispersed shale case, the water saturation equation may be written as:

and

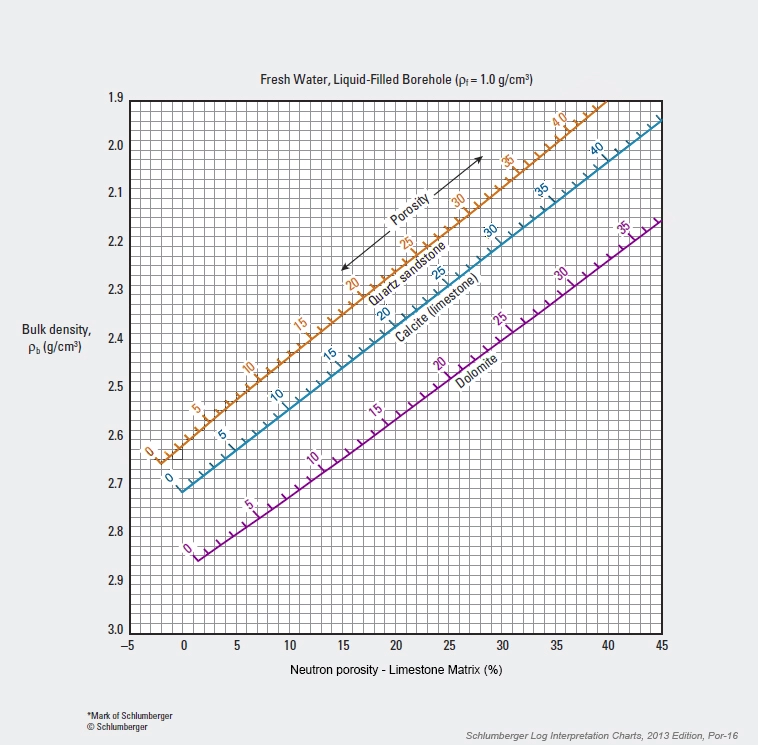
For practical purposes, ϕT, ϕe and Vdis can be calculated from the neutron porosity versus density crossplot. Figure 7 is the particular density-neutron crossplot template for use with Schlumberger’s 6.75-inch LWD azimuthal density-neutron tool in a freshwater liquid-filled borehole.
Rdis may be calculated at the shale point as: