Related Articles

Bright, Flat and Dim Spots
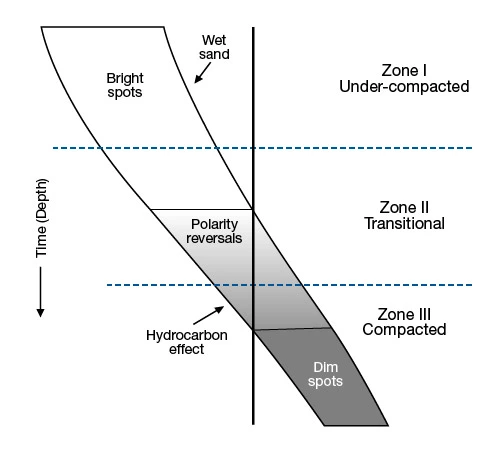
Seismic and well log data indicate that impedance in shallow, unconsolidated sands is generally lower than that of associated shales and produces a negative reflection coefficient. Impedance in older, more consolidated sands is often higher than in the shales, resulting in a positive polarity reflection. These impedance differences are respectively referred to as Zone I, the unconsolidated or under-compacted section, and Zone III, the compacted section. As low impedance sands compact to become high impedance, there is a crossover or transitional interval, Zone II, where impedances for sand and shale are essentially equal. From an exploration standpoint, if we can ascertain the extent of Zones I, II, and III on seismic profiles, and the sand boundaries, we can determine geometries and fluid contents with far greater reliability (Figure 1).
We can identify reflectivity zones according to their characteristics.
Reflectivity Zones
Zone I – Bright Spots
Bright spots are abnormally large reflections that occur at the interfaces between gas sands and dry sands. They are also called amplitude anomalies. These anomalies are usually of limited extension. The determination of these events allows the direct detection of gas accumulations.
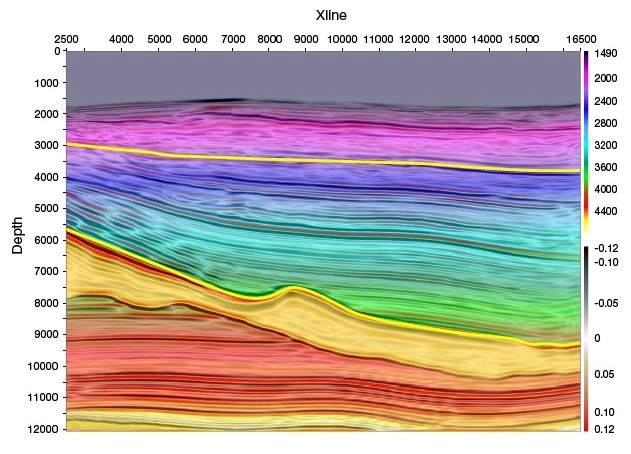
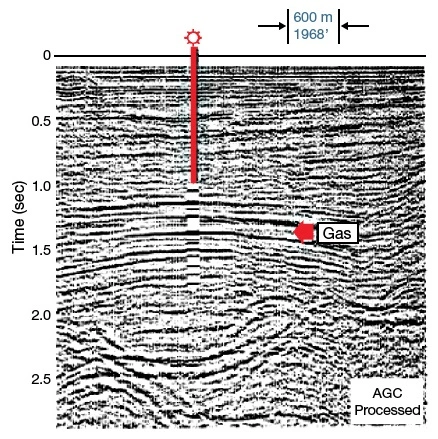
In this unconsolidated environment, where sand impedance is less than that of the adjacent shale, amplitudes for sands tend to be slightly to moderately negative. The presence of hydrocarbons, however, can double or triple the reflection coefficient, and can be easily identified on conventional or relative amplitude displays as bright spots. Referring to Figure 2, we can see high negative impedance values produced by gas saturated sands in Zone I. This shows a typical case of a bright spot. Polarity of the seismic wiggle is different if the wave travels from faster to slower or from slower to faster. The bright spot shows lateral variation of polarity as the wave travels from rock (hard or faster) to gas (slower).
Zone II – Transition
It is in this zone that our technology is least effective. For reasons we do not yet understand, even synthetic seismograms may not establish reliable correlations. Sandstone impedances show some mix of Zone I and III characters, as well as low-contrast sands in close proximity. This is the actual crossover zone. While sand and shale impedances are, on average, very close in this zone, there are great inconsistencies in reflections. The occurrence of hydrocarbons in this zone can appear as a bright spot, a polarity shift, or fade a reflection into the background.
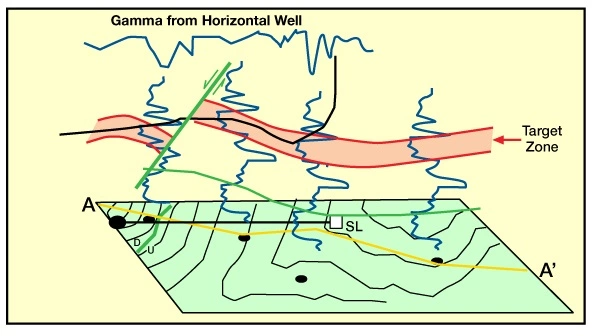
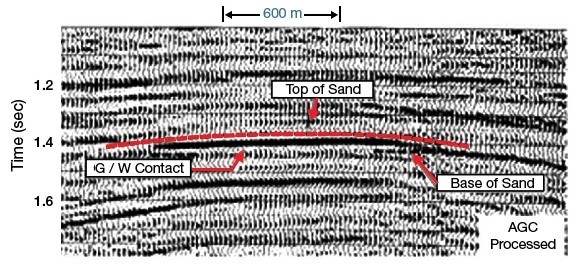
Flat spots are another kind of amplitude anomaly. They occur at the gas/oil or oil/water interfaces. These are flat compared to the surrounding geological dip. For example, we can identify an offshore US Gulf Coast sand in Figure 3. The prominent trough denoting the sand top is labeled, as is the gas/water contact, and is indicated by the essentially flat sequence of strong peaks.
Zone III – Dim Spots
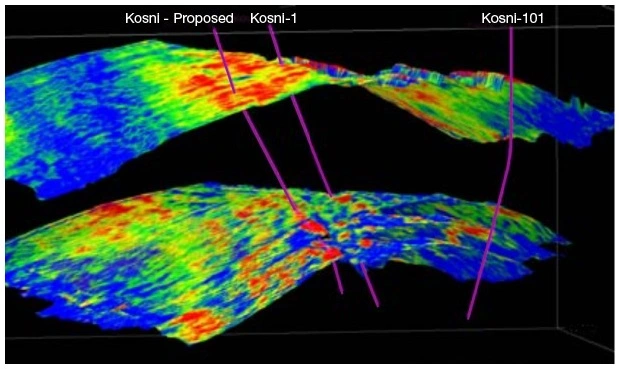
Below the bright spot zone, sands have compacted and consolidated until their acoustic impedance values are greater than those of the associated shales, due to the sand/shale crossover of velocities. Amplitudes are generally moderate to high, and tend to exhibit the geometric shapes of the depositional regime. Hydrocarbons tend to decrease velocities in absolute terms, much as seen in Zone I. In relative terms, however, the change is less than 50 percent of the wet sand reflectivity. Because this is a decrease in the reflection coefficient, the result is a dimming of the event, or a dim spot, which may not be apparent on a conventional section. We see an example of this phenomenon in Figure 4, where the wavelet has been processed to zero phase to reveal the dimming effect of a known pay interval at the dim spot.
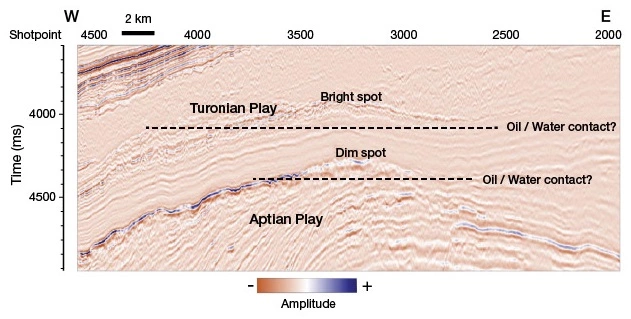
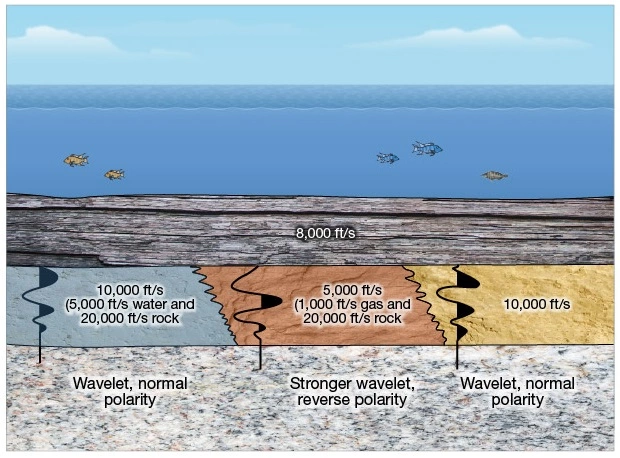
Figure 5 illustrates graphically the polarity changes that occur for different combinations of velocity contrasts caused by the presence of fluids in the geologic formation.
The subject of bright, flat and dim spots is explored in much greater detail in the IPIMS Amplitude HCIs course within the Hydrocarbon Indicators topic.