South Louisiana Model ( Turtle Prospect )
Recognizing Turtle Prospect
The South Louisiana District Office of Exeter Oil Company (a hypothetical company) generates prospects in what is one of the most highly prospective onshore provinces of the United States, despite its maturity. Figure 1 furnishes a cross-sectional model of the geological setting.
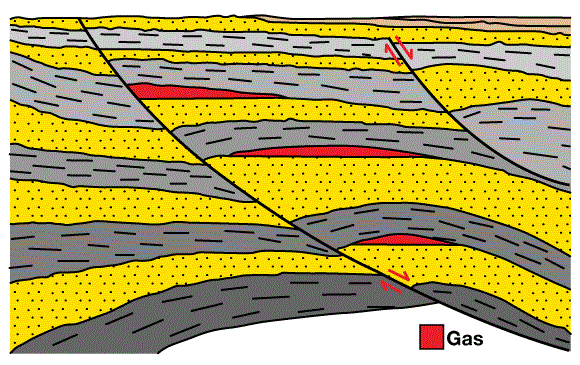
It illustrates that several overlapping prospects, some deeper and others shallower, normally exist together at a given location within such growth fault-rollover anticline plays.
By using log data, the Exeter staff carefully contoured the subsurface structure at several levels, and made isopach maps measuring structural growth in the thick and prolific Upper and Middle Frio sequence (Oligocene). A downthrown structural closure was mapped at a depth of about 12,000 ft at the level of the Middle Frio Marginulina texana zone. Figure 2 shows this prospect map with its attached type log.
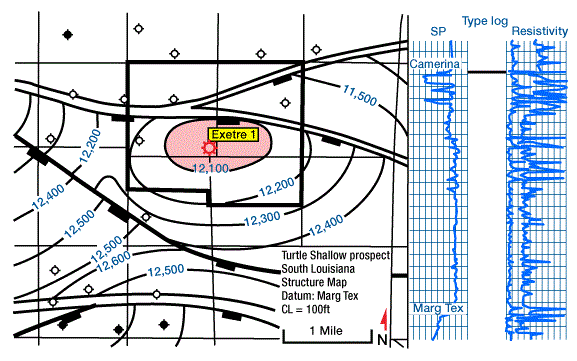
It should be noted that constituent subdivisions of the Frio Formation are based on foraminiferal zones.
A minor gas field exists at Upper Frio level, but most of the wells in this region did not go below the Upper Frio to test the Middle Frio. On the strength of the subsurface map, Exeter assembled an 1800-acre lease block called Turtle prospect (Figure 2).
Acquiring Additional Data
At this point, Exeter’s geophysicists began assembling all the seismic data they could find in the vicinity of Turtle prospect. By swapping lines with other companies, purchasing some modern taped records from a data bank, and integrating and reinterpreting all these lines, Exeter determined that in addition to the Marg Tex closure mapped from subsurface data, there was a deeper anticlinal structural closure at about 13,500 ft (Bolivina mexicana 3 level) (Figure 3).
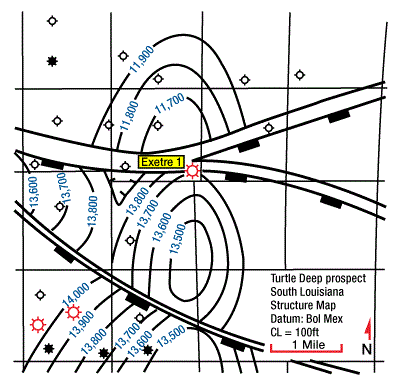
In a field about four miles north of Turtle, sands at this level are prolific producers. Based on deep dry holes on the flanks of the prospect, good sandstone objectives are known to exist in this deeper zone. Also dipmeter logs from these wells confirmed the mapped closure. Turtle prospect, therefore, became two prospects: Turtle Shallow and Turtle Deep.
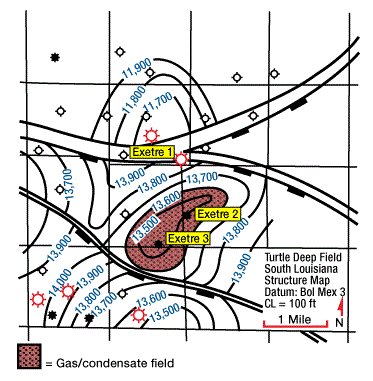
The Turtle Shallow prospect was drilled (Exeter 1) by Exeter in mid-1980 (Figure 2) resulting in a small gas well from a Camerina sand at about 11,000 ft. The target Marg Tex sand was found structurally as anticipated, but it was water-wet.
The Turtle Deep prospect, about one mile to the south, then became the focus of exploration, and additional leases were picked up. Exeter drilled a wildcat to test Turtle Deep in mid-1980 (Figure 4). The well (Exeter 2) was drilled to 16,000 ft and was completed as an excellent gas condensate well in January 1981 from a 47-ft Bol Mex sand at 13,500 ft. It tested 9006 Mcf gas/day plus 228 bbl oil/day through a 16/64-inch choke.
Economic Analysis
Before this drilling activity, Exeter’s Exploration Department prepared a preliminary prospect analysis sheet to accompany the structure map shown in Figure 3. The purpose of the prospect sheet was to justify the wildcat as a business venture. These reports tell management what the potential rewards will be if the wildcat is productive, and what the costs will be for a dry hole, for a completed producer, and for the fully developed Turtle field. Obviously, some of these quantities were estimates at the predrilling stage, but management’s firm policy was: do not sign the AFE (authorization for expenditure) for any wildcat until all the potential obligations to be undertaken by the company, together with their justifications, are clearly spelled out.
First, Gross Recoverable Reserves Anticipated:
- estimated leased productive area 600 acres (based on Figure 3)
- estimated net pay thickness – 100 ft (based on a producing field four miles north)
- estimated recovery factor – 1500 Mcf/acre-ft, plus 25 bbl/MMcf Then, 600 acres × 100 ft × 1500 Mcf/acre-ft = 90,000,000 Mcf (90 billion cu ft) plus 2,250,000 bbl oil
Second, Investment Risked:
- estimated cost of 16,000 ft dry hole, plus acreage and geology/geophysics – $2,875,000
Third, Potential Undiscounted Future Net Revenue: assuming gas @ $2.50/Mcf, and oil @ $25.00/bbl (net of operating costs and severance taxes), and a net revenue interest (NRI) after royalty payments of 80 %.
- oil revenue

- gas revenue

- undiscounted future net revenue- $45,000,000 plus $180,000,000 less investment risked ($2,875,000), completion costs and cost of one development well ($3,700,000) = $263,425,000
Fourth, Ratio of Potential Undiscounted Return to Risk Investment:
Fifth, Probability of Success:
- Based on Exeter’s overall experience in South Louisiana wildcat ventures, a mean success ratio of 1 discovery out of eight wildcats (1/8 or 0.125) was used. (This is rather a conservative value for a well-controlled prospect like Turtle.)
Sixth, Risk Adjusted Return to Risk
Investment:
- This is the Return/Risk Ratio multiplied by the Probability of Success

Seventh, Return on Investment (ROI):
- The potential return divided by the total investment ($2,875,000 exploration cost+$3,700,000 completion and development cost)

Eighth, Payout:
- At a predicted production rate of 10 MMcf/day, the initial well is anticipated to pay back the original risk plus completion costs of $3,575,000 in 4.7 months after production begins.
Taking these figures at face value, Exeter’s management decided to risk the $2,875,000 based on the risk adjusted probability that the well would return a minimum of 9.5 times the investment risked, and with luck, possibly over 75 times the investment. Many smaller exploration companies regard a 3/1 Risk Adjusted Potential Return as an acceptable risk. Larger companies, and especially those with complex integrated refining and marketing operations, have to consider factors other than return on risk and return on investment (ROI). Payout time and rate of cash flow are always important factors and are frequently decisive in evaluating a prospect.
In the preceding calculations it was assumed that revenue is received the moment a well is completed. This is rarely the case, because markets and transportation of liquid and gaseous products have to be arranged, and that takes time. Also, of course, the income stream is earned throughout a period of time. Because time is money in the sense that money earns money through time, a full economic analysis must discount future income to its present value. Megill’s Exploration Economics (1971) discusses choices among investment opportunities using economic criteria. It is an excellent corrective for geologists who tend to judge investments solely on their geological merits and may waste time on prospects which are undesirable in terms of potential earnings.
It is apparent that Turtle Deep field as discovered (Figure 4) is not as large as was anticipated before Turtle Deep prospect was drilled. The area of anticlinal closure is about 600 acres, the same as predicted, but the pay sand is about 50 ft thick instead of 100 ft, and gross reserves, therefore, are about half as large as expected.
 Petro Shine The Place for Oil and Gas Professionals.


