Related Articles


Sonic Log
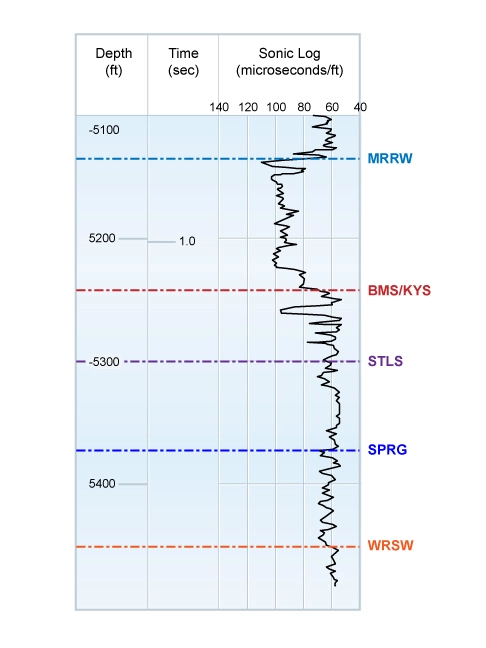
A sonic, sometimes termed acoustic, log measures the interval transit time, termed Δt, of a compressional sound wave travelling through the formation along the axis of the borehole. The well log in Figure 1 is a display of the interval transit time data in a well plotted versus depth, but the equivalent time domain is also indicated so as to more easily relate the sonic log to seismic data.
Sonic logging tools use a transducer to transmit a sonic wave from the logging tool through the drilling mud in the wellbore, then into and along the surrounding elastic formation materials adjacent to the borehole, and finally back through the drilling mud column to receivers in the logging tool. Sonic velocity logs are a record of the travel time of a sonic wave from one or more transmitters to one or more receivers in the logging tool. The tool may be run either on wireline or as part of the bottomhole assembly in logging while drilling (LWD) applications. The time of the first detection of the transmitted pulse at each receiver (termed the first arrival of the compressional wave) is processed to generate the Δt parameter. This Δt is the transit time of the wave front over one foot of formation, and is the reciprocal of the formation velocity.
Sonic energy travels through the drilling mud fluid in the borehole at that fluid’s velocity, and through the formation near the side of the borehole at a velocity that is related to both the lithology and porosity of the rocks. The interval transit time, Δt, is consequently dependent on both the lithology and porosity.
An enlarged borehole, formation fractures, gas in either the borehole or the formation, or poor tool centralization can sometimes produce signal attenuation, which may result in “cycle skipping” or Δt spikes to higher values. Lack of standoff or excessive wireline logging speed can result in noise or Δt spikes to either higher or lower values. Continually improving sonic log tool technology has resulted in reducing the frequency of such invalid data over recent years.
Most sonic logging tools (Figure 2) use magneto-restrictive or piezoelectric transducers that convert electrical energy to sonic energy. Many of the transducers are pulsed from 2 to 10, or more, times per second, and the sonic energy emitted has a frequency in the range of 20 to 35 kHz.

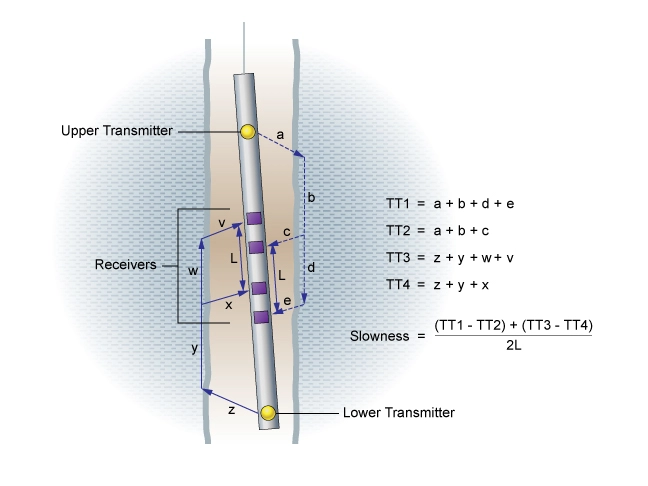
Sonic logging tools are constructed of low-velocity materials, enabling the shortest travel path for the sonic pulse from the transmitters to the receivers (Figure 3) to be through the borehole fluid and then the adjacent rocks, which have a velocity faster than that of the fluid, rather than directly through the drilling mud or the logging tool. Figure 3 displays a common sonic tool configuration of two transmitters located on either side of four receivers. Sonic logging tools are able to evaluate porosity because the compressional velocity of sound in fluid in pore spaces is less than the velocity in rock. The first arrival at the receiver is that compressional wave which travels through the formation. Sonic log terminology sometimes uses the term slowness, which is the reciprocal of the velocity.
A compressional wave (P-wave) is an elastic body wave, or sound wave, in which particles oscillate in the direction that the wave propagates (Animation 1). If there is fluid-filled pore space in the rock, the sonic energy will take longer to get from the transmitter to the receiver than would be the case in solid rock matrix of zero porosity.
Wireline sonic tools are often centralized by the use of bow springs or rubber fingers so that the travel path between the tool and the formation will be of consistent length. LWD sonic tools are centralized within the wellbore due to the bottomhole assembly, of which they are a lower part, being centrally positioned in the open wellbore.
Sonic logs can be used to help:
- Estimate the porosity.
- Establish the time-to-depth relationships in a wellbore (Figure 4).
- Determine pore pressure.
- Estimate the amount of secondary porosity.
- Assess rock mechanical properties.
- Determine the formation lithology.

Porosity Estimation From Sonic Logs Alone
Several relationships between the sonic travel time and the porosity have been suggested by petrophysicists over the past several decades. The most used historically is the Wyllie (1958) time average equation. The equation proposes that the total travel time recorded on the sonic log is the sum of the time that the sonic wave spends travelling through the solid part of the rock, termed the rock matrix, and the time spent travelling through the fluids in the pores. The Wyllie time average equation is:

Where:
V= seismic velocity of the formation
Vf= seismic velocity of the pore fluid
Vmat= seismic velocity of the rock matrix
ϕ= porosity
Table 1 shows matrix velocities and travel times of some common rock types and drilling fluids.
| Table 1. Matrix Velocities and Travel Times of Some Common Rock Types and Drilling Fluids | ||
|---|---|---|
| Formation/Fluid | Matrix Velocity (ft/sec) | Matrix Travel Time (microseconds/ft) |
| Sandstone | 18,000 | 55 |
| Limestone | 20,833 | 48 |
| Dolomite | 22,727 | 44 |
| Anhydrite | 20,000 | 50 |
| Salt | 14,925 | 67 |
| Shales, depending on their degree of compaction | 5,988 to 16,129 | 62 to 167 |
| Salt water mud | 5,405 | approx. 185 |
| Fresh water mud | 5,291 | 189 |
| Oil base mud | 4,348 to 4,762 | 210 to 230 |
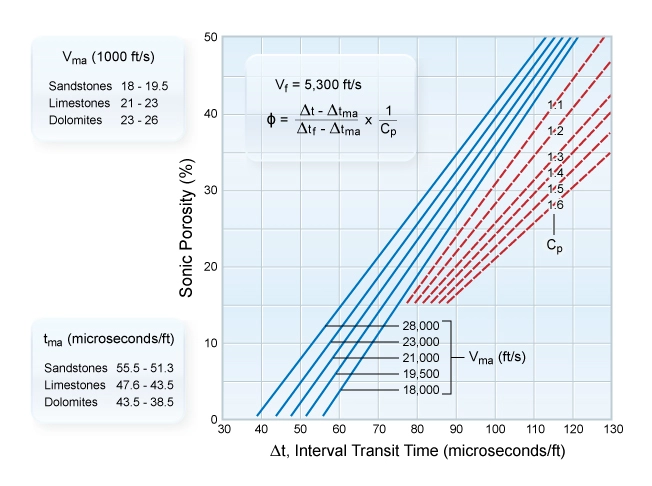
The Wyllie equation is empirical and makes no allowance for either the structure of the rock matrix or the connectivity of the pore spaces. The original, basic equation was used for both consolidated and compacted formations. However, in poorly consolidated or unconsolidated rocks, a correction factor is necessary, so that:

The compaction correction factor Cp is defined as:

Where:
Δsh= specific sonic transit time in overlying shales (μsec/ft)
100= assumed sonic transit time in compacted shales (μsec/ft)
The shale compaction correction factor (Cp) generally ranges from 1.0 up to 1.6 in the extreme case (Figure 5) and is a function of the regional geology and the degree of shale compaction at the depth being evaluated.
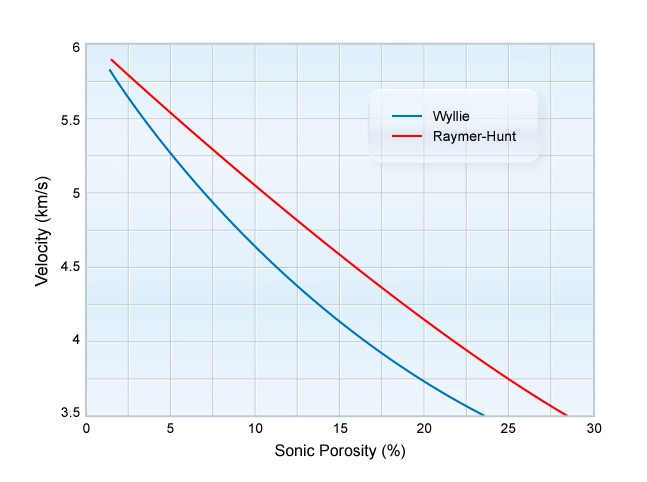
Raymer, Hunt and Gardner (1980) proposed an empirical sonic transit time to porosity transform, termed the Raymer-Hunt equation, based on field observations. Their equation was introduced to correct for observed anomalies and the shortcomings of the Wyllie time average formula.

Where:

The Raymer-Hunt equation generates slightly higher porosities than the Wyllie formula (Figure 6). It provides an improved porosity correlation over the entire porosity range. However, in unconsolidated and uncemented rocks with slow velocities, neither the Wyllie nor Raymer-Hunt empirical velocity-to-porosity transforms may be adequate for a quality porosity determination.
Dvorkin and Nur (2001) reviewed both the Wyllie time average equation and the Raymer-Hunt equation and concluded that:
- The Raymer-Hunt equation is an improved version of the Wyllie time average equation and can be reliably used to relate compressional (P) wave velocity to porosity in cemented, saturated sandstones over a wide porosity range.
- Neither of these empirical equations should be used to relate velocity to porosity in unconsolidated, uncemented rocks.
Limitations of Deriving the Formation Porosity From Sonic Logs Alone
There are significant limitations to relying solely on sonic logs for the determination of the formation porosity, primarily:
- The sonic tool triggers on the first signal arrival, which would have travelled along the fastest available route. Consequently, the sonic porosity measures the primary, intergranular porosity only, failing to capture any contribution from secondary porosity (Figure 7). Being centralized, the first arrival at the receiver travels along that part of the borehole wall’s circumference with the highest velocity and lowest porosity.

- Most formations have some lithological variations within them which result in variations in their matrix velocities. Consequently, the sonic porosity derived will be inaccurate whenever the actual matrix velocity differs from that used for the computation, which often defaults to a constant value throughout each formation due to the lack of detailed matrix velocity data.
- Corrections need to be made for the shale content, which can be a large correction unless the shale is well compacted. It is, therefore, critical to establish an accurate shale volume and make a good correction for it to achieve even a reasonably accurate porosity estimation.
As a consequence, sonic porosity is generally only used alone for porosity determination when the density and neutron logs are unusable, due to rugose borehole conditions preventing good density pad contact, or density tool malfunction, unavailability due to adverse wellbore conditions, or other reasons.
Secondary Porosity Determination
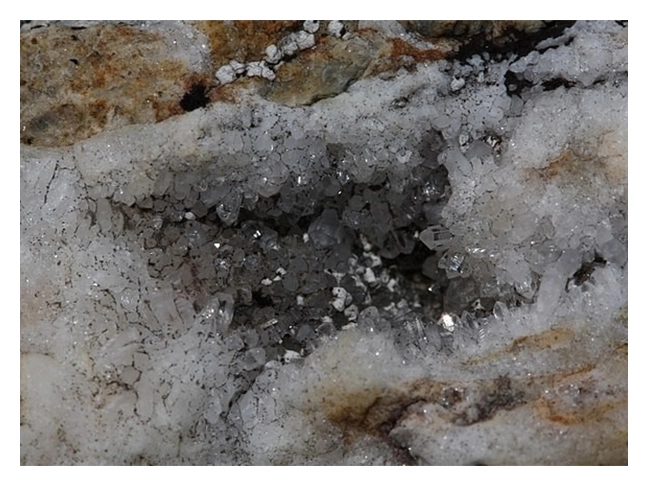
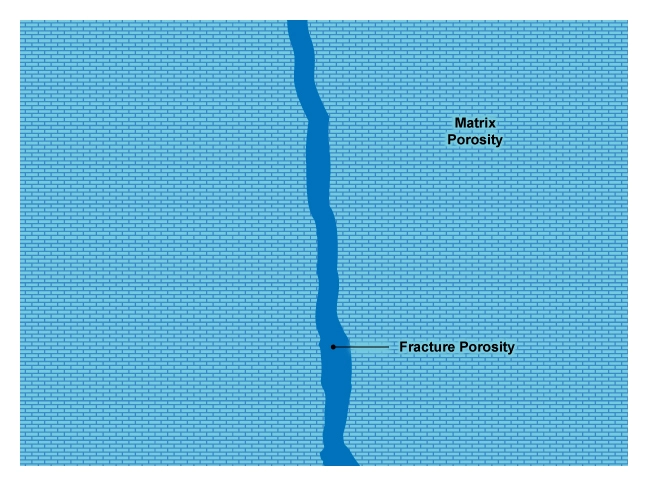
Neutron and density logs respond to the total porosity within the formation, regardless of its form or distribution. Sonic logs, in contrast, do not measure the secondary porosity, such as vugs (Figure 8) and fracture porosity (Figure 9). This is because the first arriving compressional wave passing through the formation is the one which finds the fastest path through the rock matrix to the receiver. This fastest route is normally through the formation around the fluid-filled vugs and fractures, rather than through the slower velocity fluid within them. As the sonic tool registers the first arrival time of the compressional wave, it follows that the sonic porosity, ϕs, represents the primary, or intergranular, porosity. This phenomenon has an advantage for interpretation petrophysicists. A comparison of the density-neutron crossplot porosity and the sonic porosity, provided the appropriate corrections for any shale and hydrocarbons have been made, helps to indicate whether secondary porosity is present or not. If the density-neutron crossplot porosity exceeds the sonic porosity, there are potentially some vugs and/or fractures in the formation.