Related Articles


Density Log
Density Log Overview
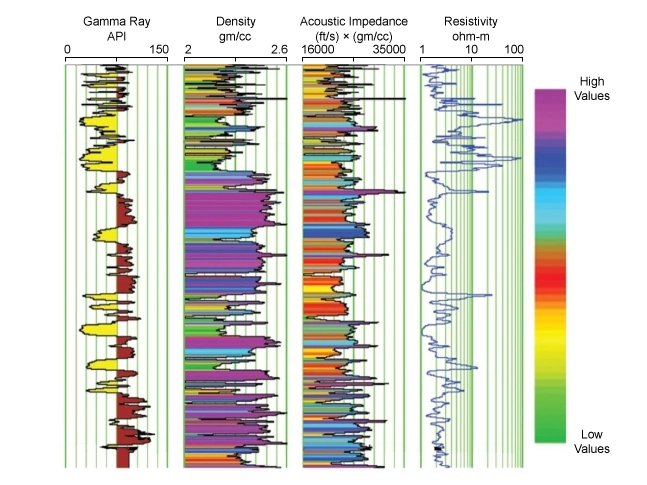
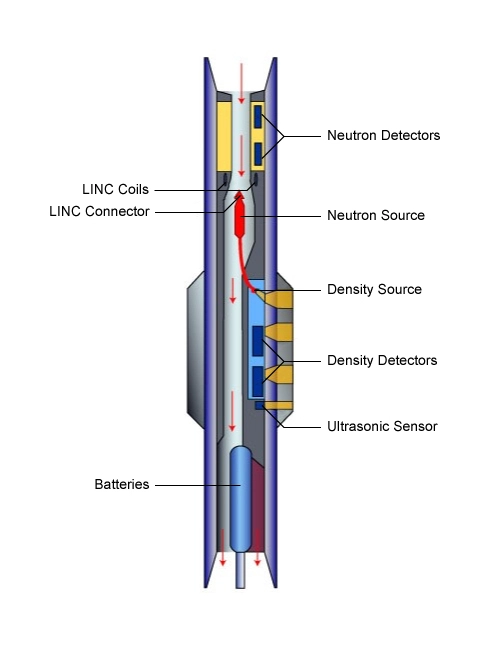
A density well log (Figure 1 ) is generated by logging while drilling (LWD) and wireline well logging tools that provide a continuous record of a formation’s bulk density along the length of an open borehole. No overall distinction is made in this topic between those density logs obtained with logging while drilling tools (Figure 2) and those acquired on wireline. Logging tool conveyancing systems are covered in full detail in another IPIMS topic, entitled “Logging Equipment and Procedures.”
The density of a mixture of mineral components in a rock formation is a linear function of the densities of its individual constituents (Abu-Khamsin, 2004). It is, therefore, possible in certain circumstances to calculate the porosity of a rock formation from a density log reading alone. For this purpose, it is useful to first consider the bulk volume model of a clean (shale-free) formation with water filling all the pore space (Figure 3).
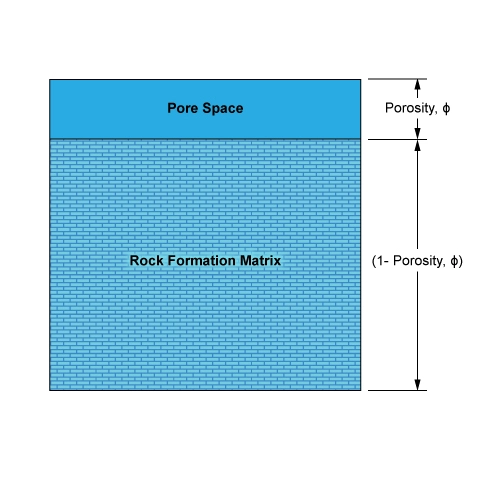
The unit volume of shale-free, water-bearing porous rock consists of a component, the porosity ϕ, containing water and another component, (1−ϕ), composing the solid rock matrix.
Thus, the bulk density of the sample can be written as:

Where:
ρb is the bulk density measured by the density logging tool.
ρma is the rock formation matrix density.
ρf is the fluid density filling the pore space.
Rearranging the terms leads to an expression for density porosity, ϕD, given by:

This is illustrated in Figure 4, where the bulk density is plotted against the density porosity.
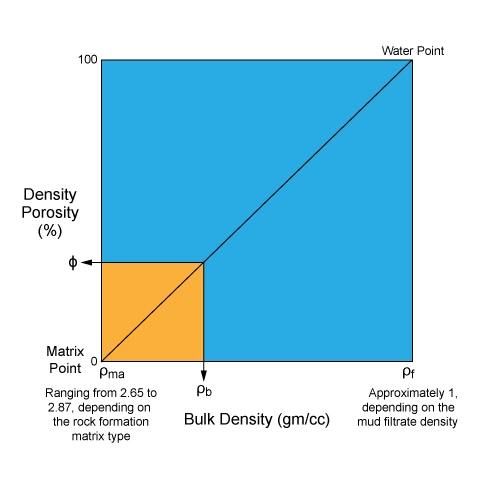
Points falling on the line connecting the matrix point (ρma, ϕ=0%) and the water point (ρf, ϕ=100%) represent all possible cases, from a zero porosity rock matrix up to a theoretical 100% porosity. The value of ρma is best obtained from core analysis. It normally ranges from about 2.65 gm/cc for sandstone through 2.71 gm/cc for limestone to about 2.87 gm/cc for dolomite. The value of ρf is normally about 1 gm/cc but varies according to the invading mud filtrate density. Any intermediate value of ρb corresponds to a specific porosity, ϕ.
Porosity is sometimes quoted as a decimal, such as for use in hydrocarbon in place calculations, and at other times it is expressed as a percentage. Most usefully and unambiguously, it is stated as “porosity units” to avoid any misunderstanding when discussing the percentage changes in the porosity.
The interpretation assumption is made that the bulk density of the formation, ρb, is what the density tool measures. Density porosity can be determined by computer or calculator, or with a chart (Figure 5), which generalizes the concept from Figure 4 and has built-in response lines for a number of different common rock matrix materials and pore-filling fluids. Such charts are available from the major service companies who provide logging while drilling (LWD) and wireline logging services (Baker Hughes, 2019; Halliburton, 2019; Schlumberger, 2019).
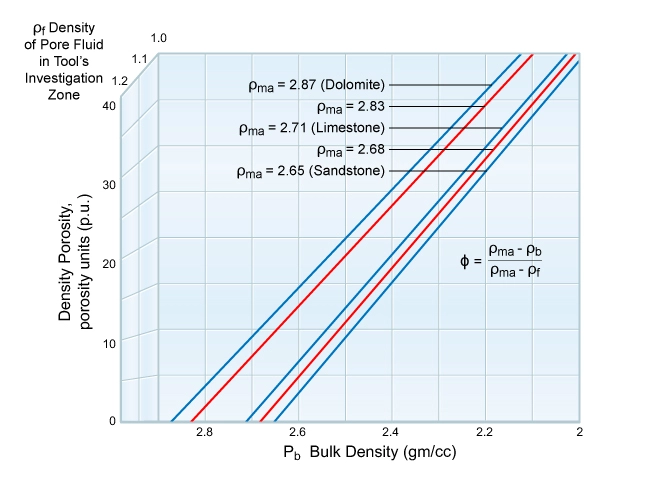
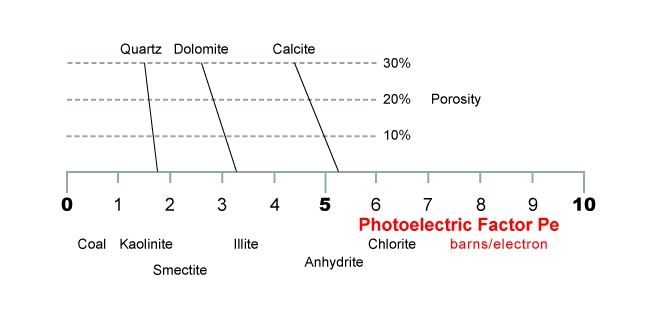
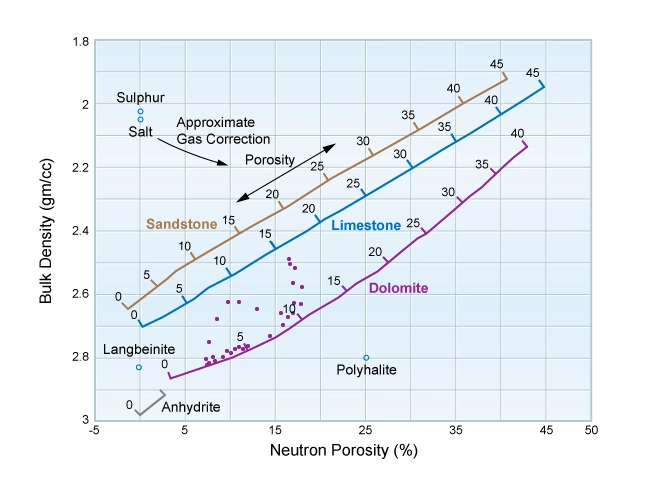
Figure 6 displays, on the y-axis scale, the matrix grain densities of some minerals commonly found in sedimentary rocks, including other data on the x-axis acquired with a density logging tool.

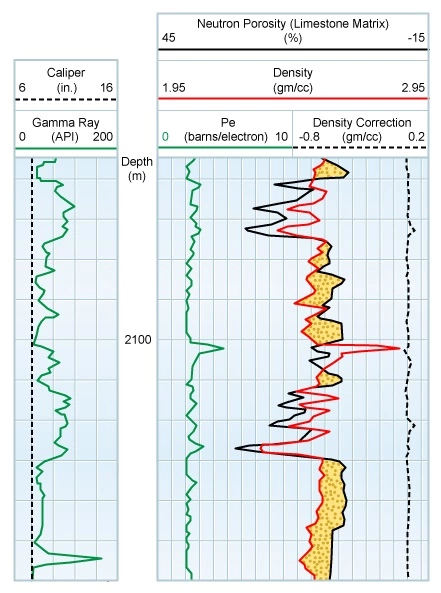
This derivation of the formation porosity assumes a clean rock formation of a consistent and known matrix density and water filling all the pore spaces. In LWD and wireline density logs, the photoelectric factor (Pe) data acquired in conjunction with the density log can help to determine the lithology, provided barite is not used in the drilling mud, as this badly distorts the photoelectric factor reading. In the absence of core analysis data, the photoelectric factor can be used, in favorable conditions, to estimate the matrix density in conjunction with all other available lithology indicators. The photoelectric factor component of the density tool records the absorption of low energy gamma rays by the formation, and is quoted in units of barns per electron. The Pe value is a good indicator of the mineralogy because it is a direct function of the aggregate atomic number of the elements in the formation, and is much less sensitive to pore volume changes than either the neutron or density logs. Figure 7 shows the common reservoir rock mineral reference values of the photoelectric factor: quartz for sandstones 1.81, dolomite 3.14, and calcite for limestones 5.08 barns/electron, all with minor variations for different porosities.
Computed density porosity values, ϕD, using the density log alone are not initially correct when:
- The formation lithology is mixed, and/or of unknown matrix density.
- Shale is present.
- Gas, or light hydrocarbons, are present in the density tool’s zone of investigation.
- Pad contact with the formation is lost in washed-out holes, in which case the tool often reads the much lower density drilling mud rather than the rock formation.
Since the shallow-reading density tool’s measurements are made in the invaded zone adjacent to the borehole wall where drilling mud filtrate has flushed away much of the original formation fluids (Animation 1), the value of ρf is primarily influenced by the mud filtrate density. In both oil base and water base drilling muds, the mud filtrate density depends on the density of its mobile fluid phase.
A drilling fluid referred to as an oil base mud is often an inverted emulsion with the oil phase being continuous. Most oil base muds now have some emulsified water content. These muds are designed so that water is not lost in filtration. In water base muds, the mud filtrate is water, whose density is a function of its salinity, pressure and temperature (Figure 8).

Mud filtrate invasion depends on several factors, which are either controllable by the well operator or are non-controllable. For example, a low pressure differential between the drilling mud fluid pressure and the reservoir pressure at the sandface and increased drilling speed, both of which tend to limit the mud filtrate invasion, are factors that the well operator can somewhat control. Non-controllable factors are related to the reservoir rock’s characteristics and fluid properties.
Shale Effects on the Density Log
If a third component, shale, is introduced in addition to the rock matrix and fluid, the same principles can be applied. Figure 9 illustrates a bulk volume model of such a shaly formation.
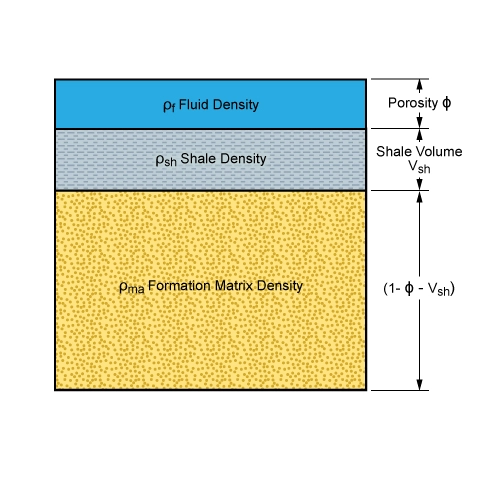
The volume fraction of shale, or shale volume, is referred to as Vsh. The resultant matrix volume in a porous, shaly formation is, therefore, (1−Vsh−ϕ).
An equation may be written for the bulk density:

Hence,

or

Where:
ϕDsh is the apparent density porosity of the shale.
ϕD is the apparent density porosity.
Because most shale densities are lower than each of the sandstone, limestone and dolomite matrix densities, the apparent density porosity, ϕD, in any shaly formation is almost always greater than the true effective porosity. This is particularly true in formations at shallow and medium burial depths, where the shale is still not fully compacted, and thus of low to moderate bulk density. In very deeply buried shaly formations, the shale density can approach that of the rock matrix, in which case the effect on the density porosity calculation is much reduced.
It is a common practice among petrophysicists to correct the log density readings for the effects of shale by estimating the shale volume (Vsh) from a natural gamma ray or SP log, a density-neutron crossplot or the deep resistivity in an aquifer section, and reading the density tool response in a shale bed (ϕDsh). Although the procedure is not always perfectly valid (the clay materials disseminated in a sandstone may sometimes differ from those deposited in a pure shale), it often generates satisfactory initial results until detailed sedimentological and full diameter core studies are completed and integrated into the well log analysis.
Shales have some porosity and can, in certain circumstances, form reservoirs as unconventional resources, albeit with very low natural permeability requiring fracking and/or horizontal wells for commercial hydrocarbon production. If the dry clay minerals in a shale have a matrix density of 3 gm/cc, then a hydrated shale with a bulk density of 2.5 gm/cc has a total porosity of 25%. The same shale logged on an apparent sandstone porosity scale would appear to have a porosity of about 9%.
Gas and Light Hydrocarbon Effects on the Density Log
Figure 10 shows a model where a clean rock formation has some of its pore space filled with gas.
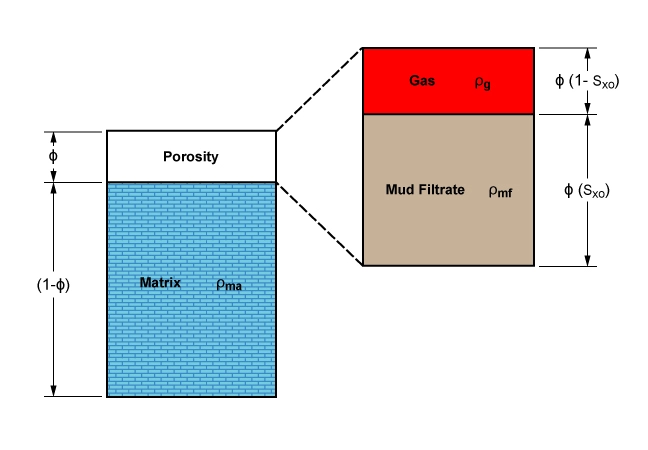
A density logging tool response based on the total pore bulk volume model for the virgin formation, before any drilling mud filtrate invasion, would be:

In this situation, the three unknowns of the equation, ϕ (porosity), Sw (water saturation) and ρg (gas density), make the interpretation difficult without either additional formation measurements or good estimates of the unknown values.
The total, or bulk, volume equation can be written for the case after drilling mud filtrate invasion as:

Values for each of the porosity, ϕ, gas density, ρg, and water saturation in the invaded zone, Sxo, are not known.
Light hydrocarbons remaining in the density tool’s zone of investigation will always result in a high apparent density porosity, because the light hydrocarbons are always less dense than the formation water or drilling mud filtrate, whether it is from an oil base or water base drilling fluid.
Several techniques have been attempted to correct the density log—as a single log measurement in isolation—for the effects of any light hydrocarbons in the zone being investigated by the tool, whether an LWD or wireline density device. Unfortunately, there are too many unknowns and uncertainties to consistently ensure a reliable porosity determination.
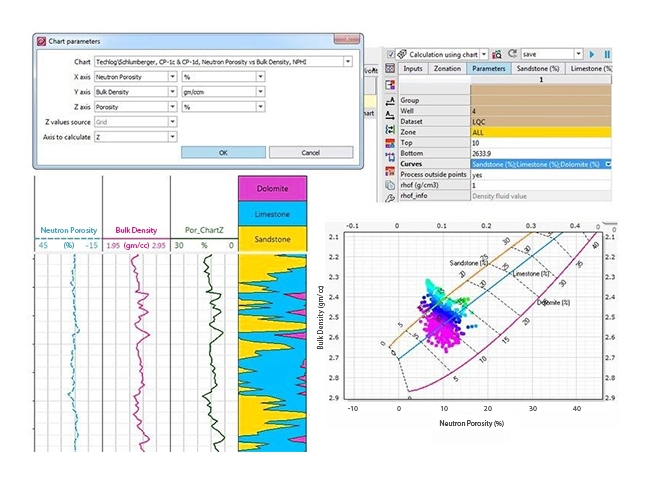
Using the density and neutron porosity logs in combination for porosity determination is a much more robust, and very frequently used, technique. In a large majority of wells where openhole log porosity measurements are acquired, the density log is run in combination with a neutron porosity log. Apart from the major benefit of accommodating uncertainties in the formation lithology, the density-neutron crossplot (Figure 11) allows a significantly better methodology than the density log alone for making corrections for the often significant effects of both shale and hydrocarbons in the zone of investigation.
Density logs are best interpreted using software (Figure 12) that integrates all the wellbore information, such as Techlog (Microsoft and Schlumberger, 2019), EasyTrace (Beicip Franlab, 2019) or Interactive Petrophysics (LR Senergy, 2019). This applies to both conventional and unconventional resource evaluations.
Depths of Investigation and the Flushing of Hydrocarbons by Mud Filtrate
The depths of investigation of both LWD and wireline density tools is quite shallow, and their readings are almost always affected by the mud filtrate invaded zone, at least in part. There are some, generally small, tool design variations between the various LWD and wireline service providers. Figure 13 illustrates the depths of investigation of a typical wireline density tool compared with a shallow focused resistivity tool and a neutron porosity tool for average conditions.
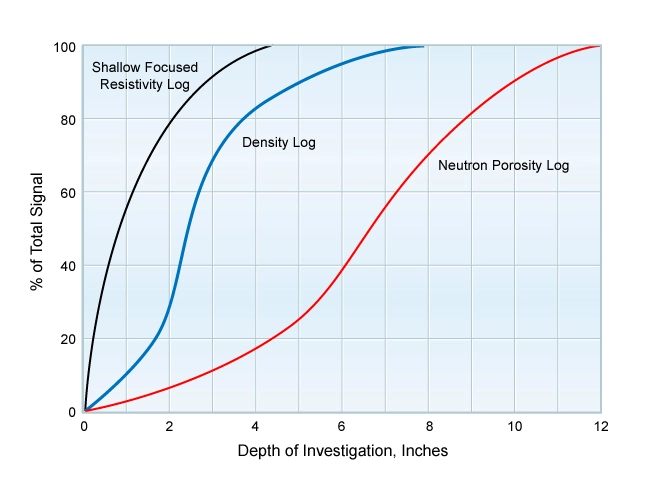
The exact shape of the density tool curve depicted in Figure 13 is also a function of the formation density and the salinity of the formation fluids, as well as the logging service provider. Almost all of a typical density tool signal comes from a region less than 8 in. from the borehole wall. A typical neutron porosity tool, by contrast, gathers its signal from the region within 12 in. of the borehole wall. If the drilling mud filtrate invasion process has left the water saturation of the flushed zone, Sxo, higher in the zone of investigation sensed by the density tool than in the zone sensed by the neutron porosity tool, then the density tool will be less affected by light hydrocarbons than the neutron porosity tool.
Where moderate to deep drilling mud filtrate invasion has occurred and any gas in the formations has been largely flushed away from both tools’ zones of investigation, there may be very little hydrocarbon effect on either acquired log. However, the inevitable lithological changes along the borehole being logged (Figure 14) mean that depth of invasion of the mud filtrate is also very variable. Array induction and array laterolog resistivity devices can often reveal an indicative mud filtrate invasion profile. This may change over time, and quite often a wireline density log can be more affected by mud filtrate invasion than its LWD equivalent, which was acquired earlier.