ad
GeologyPetrophysics

Lithology Identification From Well Logs

Multi-Mineral Analysis


Introduction

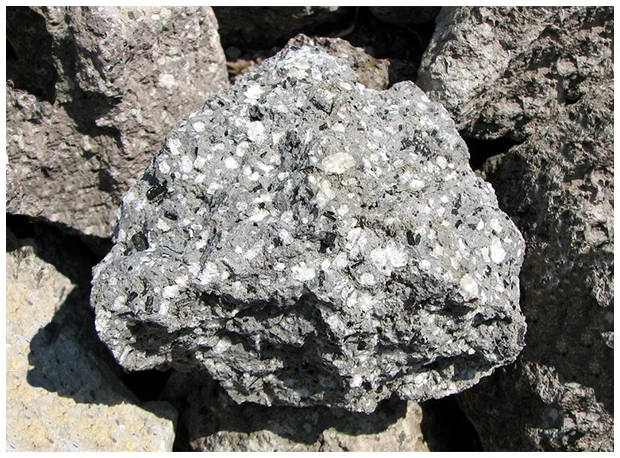
The more traditional, largely deterministic (and still very commonly used) petrophysical analysis techniques predominantly focus on the formation matrix of rocks (Figure 1), particularly shale, sandstone, limestone and dolomite. Multi-mineral analysis methods, in contrast, emphasize and investigate the mineral content of the rocks. Such log analysis techniques are often based on a probabilistic, or optimizing, approach to modeling rock and fluid data. Several of these log analysis methods compute the most probable formation lithology, mineralogy and pore fluid volumes, using a multi-log, least-squares inversion technique. Such petrophysical techniques are most applicable for complex reservoirs of mixed lithologies and mineralogies, as well as for dual porosity reservoir systems. The correct identification of the minerals likely to be encountered is critical to constraining the number of possible solutions and generating a plausible well log interpretation.

rock with a complex formation matrix, lithology, Rock type determination, Formation evaluation, Log interpretation, Well logging techniques, Well log analysis, Borehole geophysics, Geophysical logs, Wireline logging, Well log data, Lithologic characterization, Log-based lithology, Well log interpretation, Lithological identification, Formation lithology, Logging tools, Geologic interpretation, Logging parameters, Well log response, Sedimentary rocks identification, Reservoir characterization, Stratigraphic interpretation, Log-derived lithology, Rock properties estimation
Figure 1: A rock with a complex formation matrix

Multi-mineral analysis is applicable whether the well log data have been acquired by LWD or wireline. It can also be used with either oil base or water base drilling mud.

Photoelectric Factor (Pe or PEF)

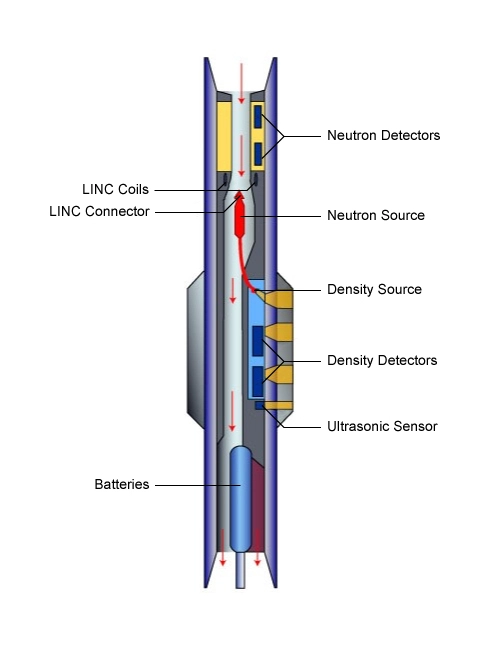
Photoelectric data—a log of the photoelectric absorption properties of the formation—are acquired in conjunction with density logging tools (Figure 2). The tools’ depths of investigation are of the order of one inch, which is invariably within the flushed zone. The log measures the photoelectric absorption factor, Pe, which is defined as (Z/10), where Z is the average atomic number of the formation. Fluids have very low atomic numbers and thus have very little influence on the photoelectric absorption, so that Pe is essentially a measure of the rock matrix properties. Sandstones composed mainly of quartz have low Pe values (1.18) while dolomites (3.14) and limestones (5.08), composed mainly of dolomite and calcite respectively, have higher values of Pe. Heavy and iron-bearing minerals have high Pe values. Consequently, the photoelectric factor log is very useful for determining the formation’s mineralogy.

Rock type determination, Formation evaluation, Log interpretation, Well logging techniques, Well log analysis, Borehole geophysics, Geophysical logs, Wireline logging, Well log data, Lithologic characterization, Log-based lithology, Well log interpretation, Lithological identification, Formation lithology, Logging tools, Geologic interpretation, Logging parameters, Well log response, Sedimentary rocks identification, Reservoir characterization, Stratigraphic interpretation, Log-derived lithology, Rock properties estimation, Logging while drilling density-neutron porosity tool schematic, density-neutron porosity tool schematic, porosity density, porosity, neutron tool, neutron porosity, lithology, lithology indicator, lithology determination from well logs, types of well logging, how to identify pine logs, lithology identification from well logs, lithology interpretation from logs, lithology logging, lithology identification, lithology identification from well logs, lithology interpretation from logs, lithology logging, lithology identification, lithology identification from well logs, lithology interpretation from logs, lithology logging, lithology identification, lithology identification from well logs, lithology interpretation from logs, lithology logging, lithology identification, lithology identification from well logs, lithology interpretation from logs, lithology logging, lithology identification, lithological logs, lithology identification from well logs, lithology interpretation from logs, lithology logging, lithology identification, lithology identification from well logs, lithology interpretation from logs, lithology logging, lithology identification, lithological logs, lithology identification from well logs, lithology interpretation from logs, lithology logging, lithology identification, lithological logs, lithology identification from well logs, lithology interpretation from logs, lithology logging, lithology identification, lithological logs, lithology identification from well logs, lithology interpretation from logs, lithology logging, lithology identification, lithology identification from well logs, lithology interpretation from logs, lithology logging, lithology identification, lithology identification from well logs, lithology interpretation from logs, lithology logging, lithology identification, lithology identification from well logs, lithology interpretation from logs, lithology logging, lithology identification, lithology identification from well logs, lithology interpretation from logs, lithology logging, lithology identification, lithological logs, lithology identification from well logs, lithology interpretation from logs, lithology logging, lithology identification, lithology identification from well logs, lithology interpretation from logs, lithology logging, lithology identification, lithology identification from well logs, lithology interpretation from logs, lithology logging, lithology identification, lithology identification from well logs, lithology interpretation from logs, lithology logging, lithology identification, lithology identification from well logs, lithology interpretation from logs, lithology logging, lithology identification, lithology identification from well logs, lithology interpretation from logs, lithology identification, lithology logging, lithology identification from well logs, lithology interpretation from logs, lithology logging, lithology identification, lithology identification from well logs, lithology interpretation from logs, lithology logging, lithology identification, lithology identification from well logs, lithology interpretation from logs, lithology logging, lithology identification, lithological logs
Figure 2: LWD density tool used for acquiring photoelectric factor data

Minerals exist in combination within geological formations. As the overall photoelectric factor index is not a linear function of the Pe values of the individual components, a new term has to be calculated: the volumetric cross-section (U), which is the cross-section of a material to photoelectric absorption, in barns/cm3.

The volumetric cross-section, U, is the product of the photoelectric factor, PEF or Pe, and the electron density.


U = \rho _e \cdot P_e

An approximation is usually made by using bulk density ρb rather than electron density ρe. In complex lithology formations, the measured volumetric photoelectric absorption index is the sum of the individual volumetric photoelectric absorption indexes, weighted by their relative proportions in the formation:

U = U_1 \, V_1 +U_2 \, V_2 + \cdots

Where:

U1= volumetric photoelectric absorption index of mineral 1, etc.

V1= volumetric fraction of mineral 1 in the formation, etc.

For a porous, single-mineral, shaly formation containing hydrocarbons, a general equation can be written as:

U = \underset{\mathbf{matrix}}{(1 - \phi - V_{sh})U_{ma}} + \underset{\mathbf{water}}{\phi \, S_{xo}\, U_f} + \underset{\mathbf{hydrocarbon}}{\phi \,(1 - S_{xo})\, U_{hy}} + \underset{\mathbf{shale}}{V_{sh}\, U_{sh}}

Table 1 shows that the absorption coefficient, Uf, of both oil and fresh water used in drilling muds is substantially lower than any of the matrix coefficients, Uma, and can, therefore, be neglected without introducing a significant error. Only if very salty (salt-saturated) drilling muds are used would the term need to be included. The contribution of any residual liquid hydrocarbon in the investigation zone of the logging tool can also be neglected since Uhy is less than 0.12.


Table 1: Photoelectric Factor, Volumetric Cross-Section and Other Constants for Common Minerals and Fluids
 PeρmmaUmmaρbU
Dolomite3.142.889.112.889.05
Limestone5.082.7113.782.7113.78
Sandtone1.182.654.792.654.79
Magnesite0.833.002.502.982.47
Anhydrite5.052.9815.062.9815.06
Gypsum3.993.6918.762.359.38
Halite4.652.3612.442.049.49
Sylvite8.512.2523.081.8615.83
Chlorite*6.303.3923.632.7617.39
Illite*3.452.9210.972.528.69
Kaolinite*1.832.966.142.414.41
Montmorillonite*2.042.897.2882.124.32
Muscovite2.402.977.352.826.77
Biolite*6.273.1019.802.9918.75
Glauconite*6.373.0521.522.5416.18
Coal, bituminous0.171.990.871.240.21
Barite2674.0910914.091091
Hematite21.55.27113.55.18111.3
Freh Water0.36  1.000.36
Salt Water (330 ppk)1.64  1.191.95
Oil0.12  0.880.011
Table 1: Photoelectric Factor, Volumetric Cross-Section and Other Constants for Common Minerals and Fluids

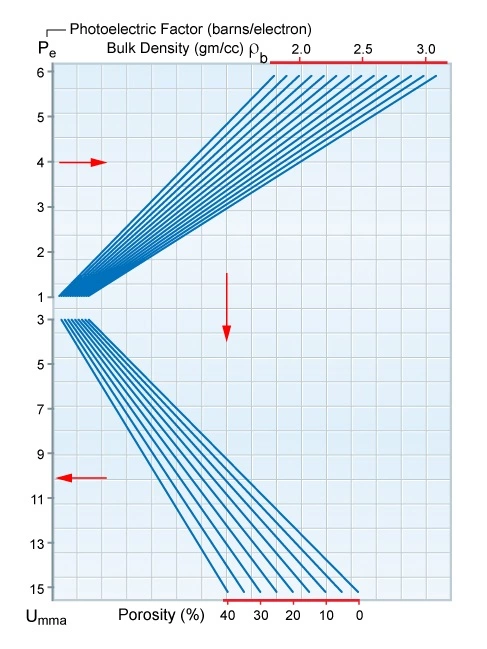
If the shale content of the formation is included in the matrix, the foregoing equations can be combined to produce the relationship:

U_{ma} = \dfrac{P_e \, \rho _e}{1 - \phi}

or more rigorously:

U_{ma} = \dfrac{P_e \, \rho _e - U_f}{1 - \phi}

This equation can be solved using petrophysical log analysis software, or the nomogram shown in Figure 3.

Rock type determination, Formation evaluation, Log interpretation, Well logging techniques, Well log analysis, Borehole geophysics, Geophysical logs, Wireline logging, Well log data, Lithologic characterization, Log-based lithology, Well log interpretation, Lithological identification, Formation lithology, Logging tools, Geologic interpretation, Logging parameters, Well log response, Sedimentary rocks identification, Reservoir characterization, Stratigraphic interpretation, Log-derived lithology, Rock properties estimation, Nomogram for deriving Umma, lithology, lithology indicator, lithology determination from well logs, types of well logging, how to identify pine logs, lithology identification from well logs, lithology interpretation from logs, lithology logging, lithology identification, lithology identification from well logs, lithology interpretation from logs, lithology logging, lithology identification, lithology identification from well logs, lithology interpretation from logs, lithology logging, lithology identification, lithology identification from well logs, lithology interpretation from logs, lithology logging, lithology identification, lithology identification from well logs, lithology interpretation from logs, lithology logging, lithology identification, lithological logs, lithology identification from well logs, lithology interpretation from logs, lithology logging, lithology identification, lithology identification from well logs, lithology interpretation from logs, lithology logging, lithology identification, lithological logs, lithology identification from well logs, lithology interpretation from logs, lithology logging, lithology identification, lithological logs, lithology identification from well logs, lithology interpretation from logs, lithology logging, lithology identification, lithological logs, lithology identification from well logs, lithology interpretation from logs, lithology logging, lithology identification, lithology identification from well logs, lithology interpretation from logs, lithology logging, lithology identification, lithology identification from well logs, lithology interpretation from logs, lithology logging, lithology identification, lithology identification from well logs, lithology interpretation from logs, lithology logging, lithology identification, lithology identification from well logs, lithology interpretation from logs, lithology logging, lithology identification, lithological logs, lithology identification from well logs, lithology interpretation from logs, lithology logging, lithology identification, lithology identification from well logs, lithology interpretation from logs, lithology logging, lithology identification, lithology identification from well logs, lithology interpretation from logs, lithology logging, lithology identification, lithology identification from well logs, lithology interpretation from logs, lithology logging, lithology identification, lithology identification from well logs, lithology interpretation from logs, lithology logging, lithology identification, lithology identification from well logs, lithology interpretation from logs, lithology identification, lithology logging, lithology identification from well logs, lithology interpretation from logs, lithology logging, lithology identification, lithology identification from well logs, lithology interpretation from logs, lithology logging, lithology identification, lithology identification from well logs, lithology interpretation from logs, lithology logging, lithology identification, lithological logs
Figure 3: Nomogram for deriving Umma

For a quick-look interpretation, the porosity ϕ can be derived from a density-neutron crossplot. In complex lithologies, with a mixture of up to three minerals, a second physical parameter is needed to define the individual minerals and their volume percentages in the formation. The apparent matrix density (ρma)a derived from the density-neutron crossplot may be used, or (ρma)a can be calculated using the standard formula:

(\rho _{ma})_a = \dfrac{\rho _b - \phi _X \, \rho _f}{1 - \phi _X}

Where:

ρf= fluid density of the invaded zone

ϕf= apparent porosity from density and neutron porosity log data

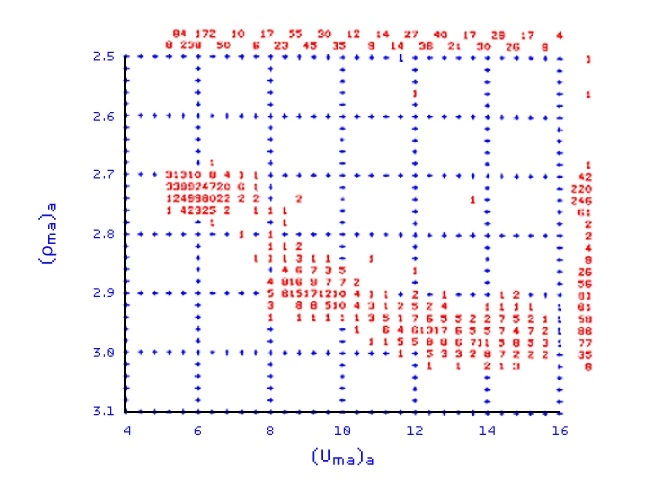
Once the values of (ρma)a and (Uma)a have been calculated, they may be crossplotted against one another to help identify the lithology. Figure 4 shows such a crossplot, made over a depth interval that includes anhydrite, dolomite and shaly sandstone.

Crossplotted data: (Uma)a versus (ρma)a, lithology, lithology indicator, Rock type determination, Formation evaluation, Log interpretation, Well logging techniques, Well log analysis, Borehole geophysics, Geophysical logs, Wireline logging, Well log data, Lithologic characterization, Log-based lithology, Well log interpretation, Lithological identification, Formation lithology, Logging tools, Geologic interpretation, Logging parameters, Well log response, Sedimentary rocks identification, Reservoir characterization, Stratigraphic interpretation, Log-derived lithology, Rock properties estimation
Figure 4: Crossplotted data: (Uma)a versus (ρma)a


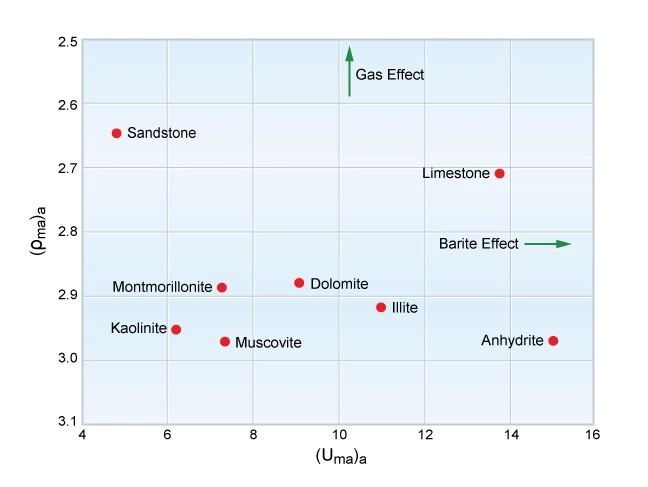
A template indicates the most probable mineral composition (Figure 5). Local geological knowledge, particularly full diameter and sidewall core analysis as well as drill cuttings, are major determinants in the selection of the main contributing components.

Template for determining mineral composition from crossplotted data: (Uma)a versus (ρma)a, lithology, lithology indicator, lithology determination from well logs, types of well logging, how to identify pine logs, lithology identification from well logs, lithology interpretation from logs, lithology logging, lithology identification, lithology identification from well logs, lithology interpretation from logs, lithology logging, lithology identification, lithology identification from well logs, lithology interpretation from logs, lithology logging, lithology identification, lithology identification from well logs, lithology interpretation from logs, lithology logging, lithology identification, lithology identification from well logs, lithology interpretation from logs, lithology logging, lithology identification, lithological logs, lithology identification from well logs, lithology interpretation from logs, lithology logging, lithology identification, lithology identification from well logs, lithology interpretation from logs, lithology logging, lithology identification, lithological logs, lithology identification from well logs, lithology interpretation from logs, lithology logging, lithology identification, lithological logs, lithology identification from well logs, lithology interpretation from logs, lithology logging, lithology identification, lithological logs, lithology identification from well logs, lithology interpretation from logs, lithology logging, lithology identification, lithology identification from well logs, lithology interpretation from logs, lithology logging, lithology identification, lithology identification from well logs, lithology interpretation from logs, lithology logging, lithology identification, lithology identification from well logs, lithology interpretation from logs, lithology logging, lithology identification, lithology identification from well logs, lithology interpretation from logs, lithology logging, lithology identification, lithological logs, lithology identification from well logs, lithology interpretation from logs, lithology logging, lithology identification, lithology identification from well logs, lithology interpretation from logs, lithology logging, lithology identification, lithology identification from well logs, lithology interpretation from logs, lithology logging, lithology identification, lithology identification from well logs, lithology interpretation from logs, lithology logging, lithology identification, lithology identification from well logs, lithology interpretation from logs, lithology logging, lithology identification, lithology identification from well logs, lithology interpretation from logs, lithology identification, lithology logging, lithology identification from well logs, lithology interpretation from logs, lithology logging, lithology identification, lithology identification from well logs, lithology interpretation from logs, lithology logging, lithology identification, lithology identification from well logs, lithology interpretation from logs, lithology logging, lithology identification, lithological logs, Rock type determination, Formation evaluation, Log interpretation, Well logging techniques, Well log analysis, Borehole geophysics, Geophysical logs, Wireline logging, Well log data, Lithologic characterization, Log-based lithology, Well log interpretation, Lithological identification, Formation lithology, Logging tools, Geologic interpretation, Logging parameters, Well log response, Sedimentary rocks identification, Reservoir characterization, Stratigraphic interpretation, Log-derived lithology, Rock properties estimation
Figure 5: Template for determining mineral composition from crossplotted data: (Uma)a versus (ρma)a

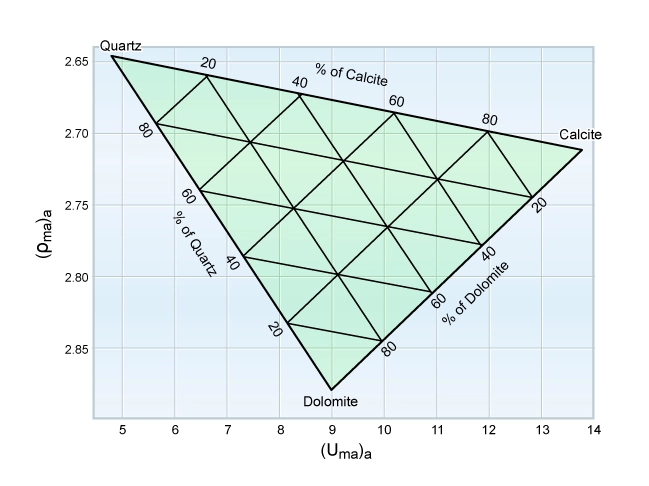
Once the main mineral components of the formation have been identified, a plot can be made to determine their relative proportions. Figure 6 illustrates a template for a quartz sandstone/calcite limestone/dolomite composition, with a grid already established.

Crossplot for determining the quartz sandstone/calcite limestone/dolomite composition, lithology, lithology indicator, lithology determination from well logs, types of well logging, how to identify pine logs, lithology identification from well logs, lithology interpretation from logs, lithology logging, lithology identification, lithology identification from well logs, lithology interpretation from logs, lithology logging, lithology identification, lithology identification from well logs, lithology interpretation from logs, lithology logging, lithology identification, lithology identification from well logs, lithology interpretation from logs, lithology logging, lithology identification, lithology identification from well logs, lithology interpretation from logs, lithology logging, lithology identification, lithological logs, lithology identification from well logs, lithology interpretation from logs, lithology logging, lithology identification, lithology identification from well logs, lithology interpretation from logs, lithology logging, lithology identification, lithological logs, lithology identification from well logs, lithology interpretation from logs, lithology logging, lithology identification, lithological logs, lithology identification from well logs, lithology interpretation from logs, lithology logging, lithology identification, lithological logs, lithology identification from well logs, lithology interpretation from logs, lithology logging, lithology identification, lithology identification from well logs, lithology interpretation from logs, lithology logging, lithology identification, lithology identification from well logs, lithology interpretation from logs, lithology logging, lithology identification, lithology identification from well logs, lithology interpretation from logs, lithology logging, lithology identification, lithology identification from well logs, lithology interpretation from logs, lithology logging, lithology identification, lithological logs, lithology identification from well logs, lithology interpretation from logs, lithology logging, lithology identification, lithology identification from well logs, lithology interpretation from logs, lithology logging, lithology identification, lithology identification from well logs, lithology interpretation from logs, lithology logging, lithology identification, lithology identification from well logs, lithology interpretation from logs, lithology logging, lithology identification, lithology identification from well logs, lithology interpretation from logs, lithology logging, lithology identification, lithology identification from well logs, lithology interpretation from logs, lithology identification, lithology logging, lithology identification from well logs, lithology interpretation from logs, lithology logging, lithology identification, lithology identification from well logs, lithology interpretation from logs, lithology logging, lithology identification, lithology identification from well logs, lithology interpretation from logs, lithology logging, lithology identification, lithological logs, Rock type determination, Formation evaluation, Log interpretation, Well logging techniques, Well log analysis, Borehole geophysics, Geophysical logs, Wireline logging, Well log data, Lithologic characterization, Log-based lithology, Well log interpretation, Lithological identification, Formation lithology, Logging tools, Geologic interpretation, Logging parameters, Well log response, Sedimentary rocks identification, Reservoir characterization, Stratigraphic interpretation, Log-derived lithology, Rock properties estimation
Figure 6: Crossplot for determining the quartz sandstone/calcite limestone/dolomite composition

Continuous computation of the relative proportions of up to three minerals is possible using this approach. Wellsite computation and display can be illustrated by an example:

A section logged with neutron porosity, density and P_e curves is first analyzed by a (Uma)a versus (ρma)a crossplot (Figure 7), which indicates the three main components of the formation to be magnetite, dolomite and anhydrite.

(Uma)a versus (ρma)a crossplot indicating the main components of the formation to be magnetite, dolomite and anhydrite, lithology, lithology indicator, lithology determination from well logs, types of well logging, how to identify pine logs, lithology identification from well logs, lithology interpretation from logs, lithology logging, lithology identification, lithology identification from well logs, lithology interpretation from logs, lithology logging, lithology identification, lithology identification from well logs, lithology interpretation from logs, lithology logging, lithology identification, lithology identification from well logs, lithology interpretation from logs, lithology logging, lithology identification, lithology identification from well logs, lithology interpretation from logs, lithology logging, lithology identification, lithological logs, lithology identification from well logs, lithology interpretation from logs, lithology logging, lithology identification, lithology identification from well logs, lithology interpretation from logs, lithology logging, lithology identification, lithological logs, lithology identification from well logs, lithology interpretation from logs, lithology logging, lithology identification, lithological logs, lithology identification from well logs, lithology interpretation from logs, lithology logging, lithology identification, lithological logs, lithology identification from well logs, lithology interpretation from logs, lithology logging, lithology identification, lithology identification from well logs, lithology interpretation from logs, lithology logging, lithology identification, lithology identification from well logs, lithology interpretation from logs, lithology logging, lithology identification, lithology identification from well logs, lithology interpretation from logs, lithology logging, lithology identification, lithology identification from well logs, lithology interpretation from logs, lithology logging, lithology identification, lithological logs, lithology identification from well logs, lithology interpretation from logs, lithology logging, lithology identification, lithology identification from well logs, lithology interpretation from logs, lithology logging, lithology identification, lithology identification from well logs, lithology interpretation from logs, lithology logging, lithology identification, lithology identification from well logs, lithology interpretation from logs, lithology logging, lithology identification, lithology identification from well logs, lithology interpretation from logs, lithology logging, lithology identification, lithology identification from well logs, lithology interpretation from logs, lithology identification, lithology logging, lithology identification from well logs, lithology interpretation from logs, lithology logging, lithology identification, lithology identification from well logs, lithology interpretation from logs, lithology logging, lithology identification, lithology identification from well logs, lithology interpretation from logs, lithology logging, lithology identification, lithological logs, Rock type determination, Formation evaluation, Log interpretation, Well logging techniques, Well log analysis, Borehole geophysics, Geophysical logs, Wireline logging, Well log data, Lithologic characterization, Log-based lithology, Well log interpretation, Lithological identification, Formation lithology, Logging tools, Geologic interpretation, Logging parameters, Well log response, Sedimentary rocks identification, Reservoir characterization, Stratigraphic interpretation, Log-derived lithology, Rock properties estimation
Figure 7: (Uma)a versus (ρma)a crossplot indicating the main components of the formation to be magnetite, dolomite and anhydrite


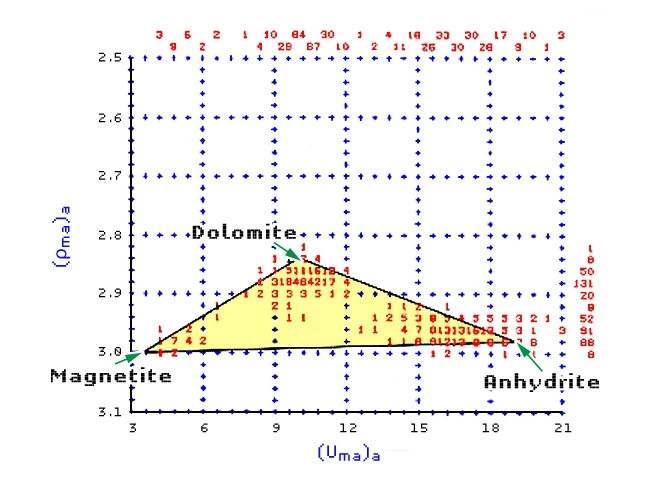
The relative proportions of the three minerals at each depth are computed according to the data points within the defined triangle. Figure 8 shows the corresponding playback of digital log data over the same interval.

Lithology identification on digital playback, lithology, lithology indicator, lithology determination from well logs, types of well logging, how to identify pine logs, lithology identification from well logs, lithology interpretation from logs, lithology logging, lithology identification, lithology identification from well logs, lithology interpretation from logs, lithology logging, lithology identification, lithology identification from well logs, lithology interpretation from logs, lithology logging, lithology identification, lithology identification from well logs, lithology interpretation from logs, lithology logging, lithology identification, lithology identification from well logs, lithology interpretation from logs, lithology logging, lithology identification, lithological logs, lithology identification from well logs, lithology interpretation from logs, lithology logging, lithology identification, lithology identification from well logs, lithology interpretation from logs, lithology logging, lithology identification, lithological logs, lithology identification from well logs, lithology interpretation from logs, lithology logging, lithology identification, lithological logs, lithology identification from well logs, lithology interpretation from logs, lithology logging, lithology identification, lithological logs, lithology identification from well logs, lithology interpretation from logs, lithology logging, lithology identification, lithology identification from well logs, lithology interpretation from logs, lithology logging, lithology identification, lithology identification from well logs, lithology interpretation from logs, lithology logging, lithology identification, lithology identification from well logs, lithology interpretation from logs, lithology logging, lithology identification, lithology identification from well logs, lithology interpretation from logs, lithology logging, lithology identification, lithological logs, lithology identification from well logs, lithology interpretation from logs, lithology logging, lithology identification, lithology identification from well logs, lithology interpretation from logs, lithology logging, lithology identification, lithology identification from well logs, lithology interpretation from logs, lithology logging, lithology identification, lithology identification from well logs, lithology interpretation from logs, lithology logging, lithology identification, lithology identification from well logs, lithology interpretation from logs, lithology logging, lithology identification, lithology identification from well logs, lithology interpretation from logs, lithology identification, lithology logging, lithology identification from well logs, lithology interpretation from logs, lithology logging, lithology identification, lithology identification from well logs, lithology interpretation from logs, lithology logging, lithology identification, lithology identification from well logs, lithology interpretation from logs, lithology logging, lithology identification, lithological logs, Rock type determination, Formation evaluation, Log interpretation, Well logging techniques, Well log analysis, Borehole geophysics, Geophysical logs, Wireline logging, Well log data, Lithologic characterization, Log-based lithology, Well log interpretation, Lithological identification, Formation lithology, Logging tools, Geologic interpretation, Logging parameters, Well log response, Sedimentary rocks identification, Reservoir characterization, Stratigraphic interpretation, Log-derived lithology, Rock properties estimation
Figure 9: Lithology identification on digital playback

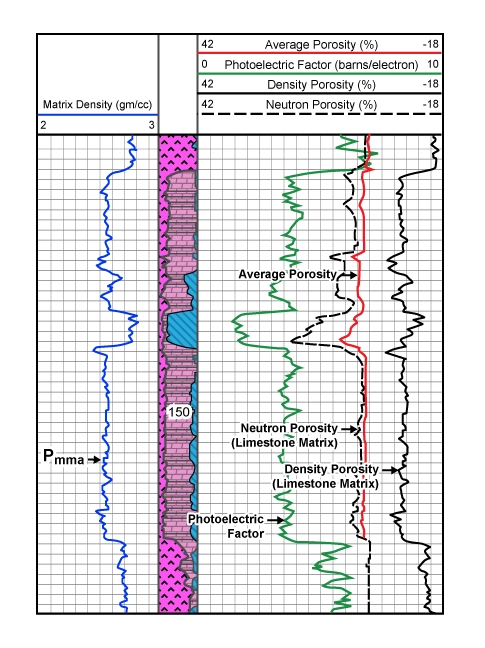
The average grain (matrix) density (RHGA) is displayed in track 1; the interpreted lithology is detailed in the depth track; and the photoelectric factor (PEF), density porosity (DPL), average porosity (PHIA) and neutron porosity (NPL) are shown in tracks 2 and 3. The porosity values are scaled in limestone units. Because of the statistical nature of the measurements, not all the data points will plot inside the selected solution triangle defined by the three minerals. When a point falls outside the triangle, this is flagged on the left edge of track 1, and only one or two minerals will be displayed.

Drilling muds containing any significant amount of barite, which has an extremely high Pe of 267, present a problem for lithology interpretation with the lithodensity log. If there is a high concentration of barite in either the mud cake or drilling mud, the very high Pe value of barite will invalidate the Pe curve for lithology determination.

Both gas in the formation pore space and barite in the mud can be detected on a (Uma)a versus (ρma)a crossplot (Figure 9).

(Uma)a versus (ρma)a crossplot, lithology, lithology indicator, lithology determination from well logs, types of well logging, how to identify pine logs, lithology identification from well logs, lithology interpretation from logs, lithology logging, lithology identification, lithology identification from well logs, lithology interpretation from logs, lithology logging, lithology identification, lithology identification from well logs, lithology interpretation from logs, lithology logging, lithology identification, lithology identification from well logs, lithology interpretation from logs, lithology logging, lithology identification, lithology identification from well logs, lithology interpretation from logs, lithology logging, lithology identification, lithological logs, lithology identification from well logs, lithology interpretation from logs, lithology logging, lithology identification, lithology identification from well logs, lithology interpretation from logs, lithology logging, lithology identification, lithological logs, lithology identification from well logs, lithology interpretation from logs, lithology logging, lithology identification, lithological logs, lithology identification from well logs, lithology interpretation from logs, lithology logging, lithology identification, lithological logs, lithology identification from well logs, lithology interpretation from logs, lithology logging, lithology identification, lithology identification from well logs, lithology interpretation from logs, lithology logging, lithology identification, lithology identification from well logs, lithology interpretation from logs, lithology logging, lithology identification, lithology identification from well logs, lithology interpretation from logs, lithology logging, lithology identification, lithology identification from well logs, lithology interpretation from logs, lithology logging, lithology identification, lithological logs, lithology identification from well logs, lithology interpretation from logs, lithology logging, lithology identification, lithology identification from well logs, lithology interpretation from logs, lithology logging, lithology identification, lithology identification from well logs, lithology interpretation from logs, lithology logging, lithology identification, lithology identification from well logs, lithology interpretation from logs, lithology logging, lithology identification, lithology identification from well logs, lithology interpretation from logs, lithology logging, lithology identification, lithology identification from well logs, lithology interpretation from logs, lithology identification, lithology logging, lithology identification from well logs, lithology interpretation from logs, lithology logging, lithology identification, lithology identification from well logs, lithology interpretation from logs, lithology logging, lithology identification, lithology identification from well logs, lithology interpretation from logs, lithology logging, lithology identification, lithological logs, Rock type determination, Formation evaluation, Log interpretation, Well logging techniques, Well log analysis, Borehole geophysics, Geophysical logs, Wireline logging, Well log data, Lithologic characterization, Log-based lithology, Well log interpretation, Lithological identification, Formation lithology, Logging tools, Geologic interpretation, Logging parameters, Well log response, Sedimentary rocks identification, Reservoir characterization, Stratigraphic interpretation, Log-derived lithology, Rock properties estimation
Figure 9: (Uma)a versus (ρma)a crossplot

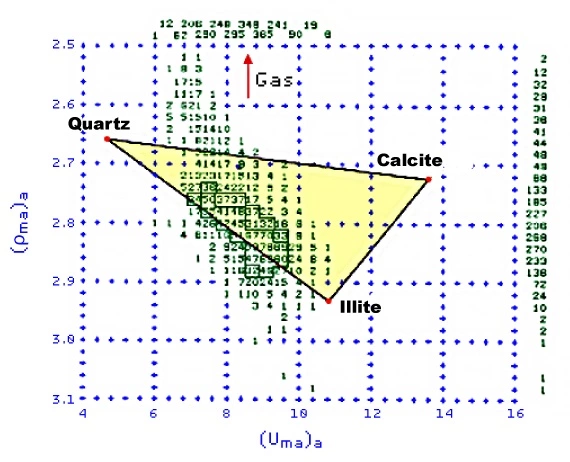
Because of its high atomic number, barite moves the (Uma)a points toward the right (higher). Gas influences the (ρma)a values, but has little effect on (Uma)a, and so moves the points upward.

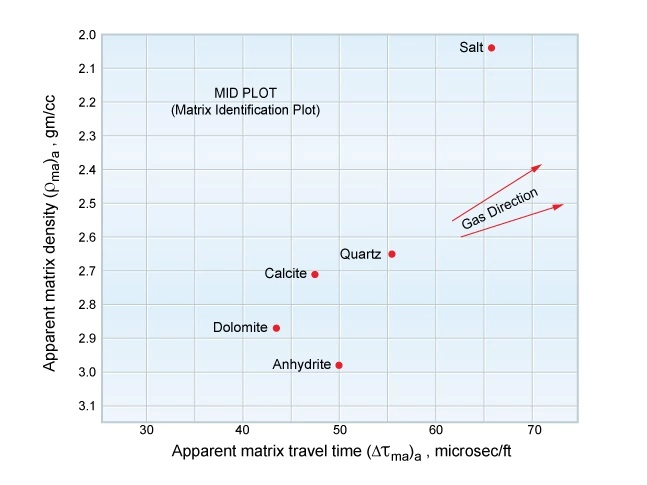
The formation lithology and mineralogy can also be inferred from a crossplot of the apparent matrix density against the apparent matrix travel time (Figure 10).

Matrix identification plot (MID) template, lithology, lithology indicator, lithology determination from well logs, types of well logging, how to identify pine logs, lithology identification from well logs, lithology interpretation from logs, lithology logging, lithology identification, lithology identification from well logs, lithology interpretation from logs, lithology logging, lithology identification, lithology identification from well logs, lithology interpretation from logs, lithology logging, lithology identification, lithology identification from well logs, lithology interpretation from logs, lithology logging, lithology identification, lithology identification from well logs, lithology interpretation from logs, lithology logging, lithology identification, lithological logs, lithology identification from well logs, lithology interpretation from logs, lithology logging, lithology identification, lithology identification from well logs, lithology interpretation from logs, lithology logging, lithology identification, lithological logs, lithology identification from well logs, lithology interpretation from logs, lithology logging, lithology identification, lithological logs, lithology identification from well logs, lithology interpretation from logs, lithology logging, lithology identification, lithological logs, lithology identification from well logs, lithology interpretation from logs, lithology logging, lithology identification, lithology identification from well logs, lithology interpretation from logs, lithology logging, lithology identification, lithology identification from well logs, lithology interpretation from logs, lithology logging, lithology identification, lithology identification from well logs, lithology interpretation from logs, lithology logging, lithology identification, lithology identification from well logs, lithology interpretation from logs, lithology logging, lithology identification, lithological logs, lithology identification from well logs, lithology interpretation from logs, lithology logging, lithology identification, lithology identification from well logs, lithology interpretation from logs, lithology logging, lithology identification, lithology identification from well logs, lithology interpretation from logs, lithology logging, lithology identification, lithology identification from well logs, lithology interpretation from logs, lithology logging, lithology identification, lithology identification from well logs, lithology interpretation from logs, lithology logging, lithology identification, lithology identification from well logs, lithology interpretation from logs, lithology identification, lithology logging, lithology identification from well logs, lithology interpretation from logs, lithology logging, lithology identification, lithology identification from well logs, lithology interpretation from logs, lithology logging, lithology identification, lithology identification from well logs, lithology interpretation from logs, lithology logging, lithology identification, lithological logs, Rock type determination, Formation evaluation, Log interpretation, Well logging techniques, Well log analysis, Borehole geophysics, Geophysical logs, Wireline logging, Well log data, Lithologic characterization, Log-based lithology, Well log interpretation, Lithological identification, Formation lithology, Logging tools, Geologic interpretation, Logging parameters, Well log response, Sedimentary rocks identification, Reservoir characterization, Stratigraphic interpretation, Log-derived lithology, Rock properties estimation
Figure 10: Crossplot of the apparent matrix density against the apparent matrix travel time

Multi-Mineral Analysis Interpretation Process


Log interpretation software for solving multi-mineral well log problems are commercially available. In many cases, the methodology is based on a simple inversion of a “response” matrix. It is most easily understood by reference to the “Martini Problem” analogy below:

A log analyst, after a hard day’s work, sought some refreshment. He ordered a drink and was immediately struck by the harmonious and mellow proportions of its ingredients. Wishing to learn the secret of the “perfect drink,” he asked the bartender to tell him how much gin, dry vermouth and sweet vermouth had been used. The bartender could only reply that it was mostly made of gin “with occasional vermouthian tendencies.” The analyst then set out to back calculate the relative proportions of the mix using the alcohol and sugar contents of the ingredients and of the mixture. He “logged” his martini to find it had 35% alcohol and 3.4% sugar. He consulted a reference book to find the amount of alcohol and sugar in each ingredient. Here is what he found:

 AlcoholSugar
Martini35%3.4%
gin47%0%
dry vermouth18%3%
sweet vermouth16%16%

He solved the problem by setting up three simultaneous equations:

alcohol:\quad 35 = 47\, V_G + 18\, V_{DV} + 16 \, V_{SV}

sugar:\quad 3.4 = 3\, V_{DV} + 16\, V_{SV}

material \ balance:\quad 1 = V_G + V_{DV} + V_{SV}

Where VG is the fraction of gin, VDV the fraction of dry vermouth, etc.

He then solved the three equations to find VGVDV and VSV, the respective fractions of gin, dry vermouth and sweet vermouth.

A similar approach can be used in the petrophysical quest for determining the formation’s constituents. Each logging tool can be used to set up a response equation describing a lithology mix. If VLVD and VS are the bulk volumes of limestone, dolomite and sandstone in some lithology mixture, for example, the density of the mixture can be expressed in terms of the relative quantities of each, and the density tool response to each:

\rho _b = 2.71\, V_L + 2.87 \, V_D + 22.65 \, V_S + \phi

In a similar fashion, the sonic and neutron logs can also define a response equation:

\Delta t = 47.5 \, V_L + 43.5 \, V_D + 55.5 \, V_S + 189 \, \phi

\phi _N = 0.07 \, V_D + (-0.03 \, V_S) + \phi

Finally, the material balance equation reveals that:

1 = V_L + V_D + V_S + \phi

For even the most mathematically inclined log analyst, deriving level-by-level solutions to matrix inversion problems manually is not realistic. Clearly, this is only realistically possible with computer analysis of digital log data.

In the above example, three independent formation measurements were combined to solve for four unknowns: porosity and the volume fractions of limestone, dolomite and sandstone. Since it requires four equations to solve for four unknowns, the material balance equation (stating that the sum of the component fractions is equal to 1) provided the missing equality. Thus, in general, given “n” independent logging measurements, a solution may be found for “n+1″ components.

For example, if, in addition to neutron porosity, density and sonic measurements, measurements of Pe and gamma ray were also available, then a solution could be sought for two additional components—for example, anhydrite and halite salt.

While the mathematics of the interpretation method is straightforward, its weakness lies in the analyst’s choice of components for which the equation is intended to solve. There will be an issue, for example, if a heavy mineral such as pyrite with Pma=4.99 gm/cc is present but not specified as a component for solution in the equation. There is a good chance that, in such a case, the point in question will fall outside the solution polygon and result in an apparent negative amount of one of the other components meant to be solved for in the equation.


Many software programs have been developed to analyze well logs in multi-mineral environments. Some have the logic for cases where an unspecified component appears, or a negative amount of a specified component results. Such programs are a useful complement to other petrophysical techniques, provided the lithology is well known and a knowledgeable log analyst determines both the components and their correct end points. An example is shown in Figure 11.

Lithology derived from multi-mineral elemental analysis interpretation of well logs, lithology, lithology indicator, lithology determination from well logs, types of well logging, how to identify pine logs, lithology identification from well logs, lithology interpretation from logs, lithology logging, lithology identification, lithology identification from well logs, lithology interpretation from logs, lithology logging, lithology identification, lithology identification from well logs, lithology interpretation from logs, lithology logging, lithology identification, lithology identification from well logs, lithology interpretation from logs, lithology logging, lithology identification, lithology identification from well logs, lithology interpretation from logs, lithology logging, lithology identification, lithological logs, lithology identification from well logs, lithology interpretation from logs, lithology logging, lithology identification, lithology identification from well logs, lithology interpretation from logs, lithology logging, lithology identification, lithological logs, lithology identification from well logs, lithology interpretation from logs, lithology logging, lithology identification, lithological logs, lithology identification from well logs, lithology interpretation from logs, lithology logging, lithology identification, lithological logs, lithology identification from well logs, lithology interpretation from logs, lithology logging, lithology identification, lithology identification from well logs, lithology interpretation from logs, lithology logging, lithology identification, lithology identification from well logs, lithology interpretation from logs, lithology logging, lithology identification, lithology identification from well logs, lithology interpretation from logs, lithology logging, lithology identification, lithology identification from well logs, lithology interpretation from logs, lithology logging, lithology identification, lithological logs, lithology identification from well logs, lithology interpretation from logs, lithology logging, lithology identification, lithology identification from well logs, lithology interpretation from logs, lithology logging, lithology identification, lithology identification from well logs, lithology interpretation from logs, lithology logging, lithology identification, lithology identification from well logs, lithology interpretation from logs, lithology logging, lithology identification, lithology identification from well logs, lithology interpretation from logs, lithology logging, lithology identification, lithology identification from well logs, lithology interpretation from logs, lithology identification, lithology logging, lithology identification from well logs, lithology interpretation from logs, lithology logging, lithology identification, lithology identification from well logs, lithology interpretation from logs, lithology logging, lithology identification, lithology identification from well logs, lithology interpretation from logs, lithology logging, lithology identification, lithological logs, Rock type determination, Formation evaluation, Log interpretation, Well logging techniques, Well log analysis, Borehole geophysics, Geophysical logs, Wireline logging, Well log data, Lithologic characterization, Log-based lithology, Well log interpretation, Lithological identification, Formation lithology, Logging tools, Geologic interpretation, Logging parameters, Well log response, Sedimentary rocks identification, Reservoir characterization, Stratigraphic interpretation, Log-derived lithology, Rock properties estimation
Figure 11: Lithology derived from the multi-mineral elemental analysis interpretation of well logs

Application of the method generates only one answer set for a given input set, since the system is exactly determined. Once the log response equations are written and the end points chosen for each component, one, and only one, solution can be found for any given set of log data. Many well logging tools’ output, such as neutron porosity, density and gamma ray data, are subject to statistical variations. Logically, the petrophysical analysis output will similarly be exposed to such statistical variations. In general, it can be stated that the most accurate assessment made by a basic multi-mineral analysis will be that of porosity.

Overdetermined Systems

The interpretation model selected by the log analyst depends a great deal on the logging program and the log responses. Ideally, the system should remain either balanced or overdetermined; in other words, the number of log inputs should not be less than the number of unknowns.

As an example, with five log measurements (ρbϕN, ΔtPe and GR) a solution is sought to the relatively simple problem of finding the relative proportions of three components—quartz sandstone, calcite limestone and dolomite. Instead of only one solution being possible, there are many possible answers. Any three log measurements suffice to form an exact solution subset, and in this case there are 10 different ways to choose three logs out of five. If all the log measurements are perfect and the model is perfectly selected, then all 10 possible solutions will coincide. In practice this never happens, and the result is a set of 10 possible answers for each component. To determine which solution is most likely to be a correct representation of the actual reservoir, a value for the original log measurements is back-calculated for each possible answer. For example, the density tool response equation may be written:

\rho _b = \rho _1 \, V_1 + \rho _2 \, V_2 + \cdots + \rho _n \, V_n

Where:


ρ1ρ2, etc. are the log responses to components 1, 2, etc.

V1V2, etc. are the volume fractions of components 1, 2, etc.

If V1,1 is the estimated value of V1 by the first of our 10 possible answer sets, then the back-calculated value of ρb is:

\rho _b = \rho _1 \, V_{1,1} + \rho _2 \, V_{2,2} + \cdots + \rho _n \, V_{n,n}

This may then be compared with the actual log reading of b and an error function defined:

E\cdot \rho _b = \rho _b - \rho _{b_{1}}

If the process is repeated for all the possible solutions, the individual error function may be summed. The same procedure may then be repeated in turn for each of the logging measurements.

The problem now transforms itself into one of minimizing the error function; establishing a solution set in which the differences between the observed log readings and the back calculated log values are minimal is the most probable solution set. A number of multi-mineral analysis programs use a multi-log, least squares inversion technique to optimize the solution.

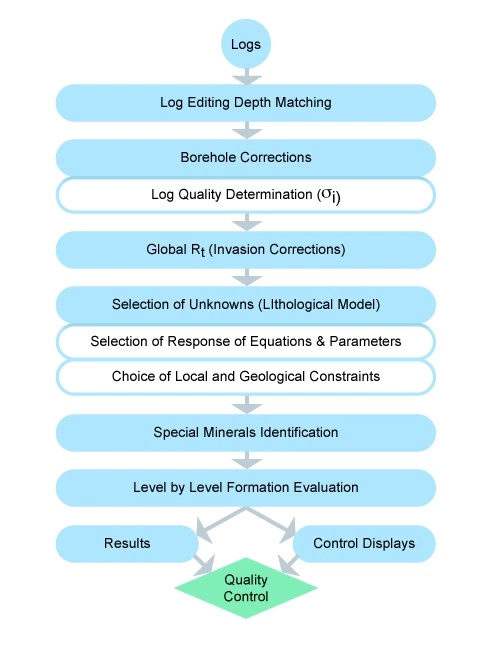
This type of petrophysical analysis, sometimes termed global logic, may be equally applied to any log response equation, including resistivity log responses to both the invasion process and to water saturation variations. Figure 12 shows a generalized flow diagram of the logical steps involved in such a log processing and analysis chain.

Multi-mineral analysis process flow diagram, lithology, lithology indicator, Rock type determination, Formation evaluation, Log interpretation, Well logging techniques, Well log analysis, Borehole geophysics, Geophysical logs, Wireline logging, Well log data, Lithologic characterization, Log-based lithology, Well log interpretation, Lithological identification, Formation lithology, Logging tools, Geologic interpretation, Logging parameters, Well log response, Sedimentary rocks identification, Reservoir characterization, Stratigraphic interpretation, Log-derived lithology, Rock properties estimation
Figure 12: Multi-mineral analysis process flow diagram

Summary

Multi-mineral analysis techniques and computer packages offer a valuable petrophysical interpretation methodology which contrasts with, and can also complement, traditional deterministic log interpretation techniques. Multi-mineral log interpretations tend to be most applicable for complex reservoirs of mixed lithologies and mineralogies.

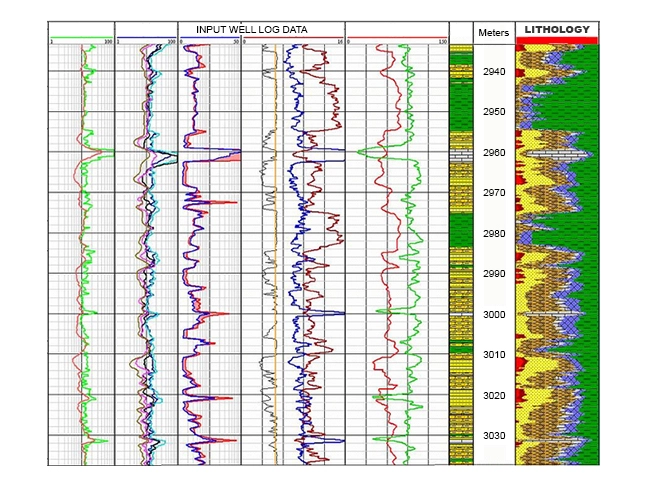
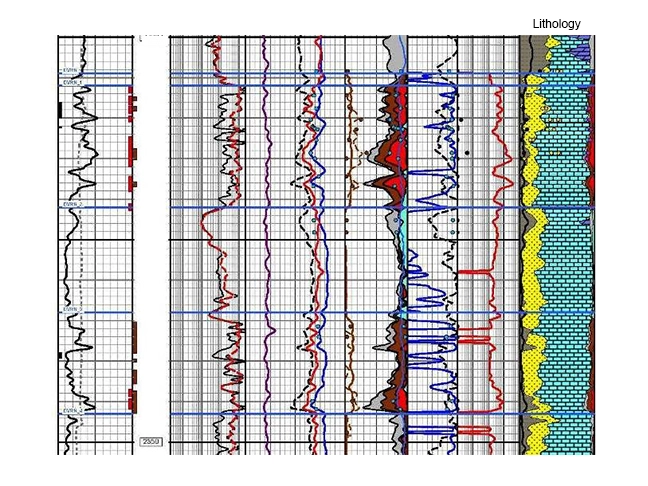
Other advantages of multi-mineral analysis are that depth intervals where the raw log data are unreliable will become evident, and that in zones of special interest the analyst will have a rigidly mathematical estimate of the probability of the analysis being correct. Computed results can be displayed to visually show subtle changes in the lithological composition of a reservoir interval over a depth range, as shown in the right-hand column of Figure 13.

Lithological changes with depth over a reservoir section, lithology indicator, lithology, Rock type determination, Formation evaluation, Log interpretation, Well logging techniques, Well log analysis, Borehole geophysics, Geophysical logs, Wireline logging, Well log data, Lithologic characterization, Log-based lithology, Well log interpretation, Lithological identification, Formation lithology, Logging tools, Geologic interpretation, Logging parameters, Well log response, Sedimentary rocks identification, Reservoir characterization, Stratigraphic interpretation, Log-derived lithology, Rock properties estimation
Figure 13: Lithological changes with depth over a reservoir section

A potential disadvantage is that the processing is particularly complex, requiring experts to apply it. Inexperienced practitioners can often generate poor and unsound solutions.


Previous page 1 2 3 4 5 6 7 8Next page

Related Articles

Leave a Reply

Your email address will not be published. Required fields are marked *

ad
Check Also
Close
Back to top button