Other Cooling Models
The McKenzie model is the most commonly applied cooling model, but models that incorporate different mechanisms for increasing the average density of the lithosphere during a heating event have been proposed. Two such mechanisms are metamorphism (Falvey and Middleton, 1981) and dike intrusion (Royden et al., 1980). Using only subsidence and heat flow data from a basin, it may be difficult to determine which mechanism occurred in a particular basin. Because subsidence in these models, as in the McKenzie model, is a response to cooling and contraction of the lithosphere, these models predict exponential subsidence and relatively flat, but decreasing, heat flow after the early history of basin formation. Consequently, we need other information to determine which model is most applicable.
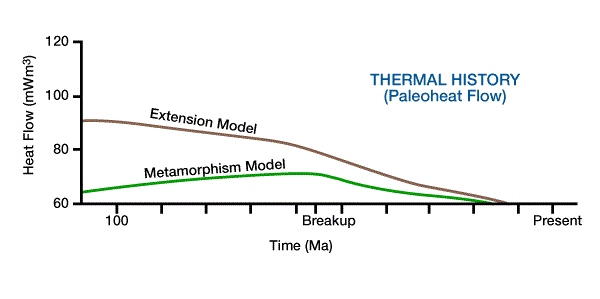
We can use early heat flow data, particularly data from the first 20 My of basin formation, to distinguish between proposed models. For an equivalent amount of heat input, the dike intrusion model predicts higher early heat flow relative to lithospheric extension because intrusions increase the temperature of the upper crust (Royden et al., 1980). Because of this increased early heat flow, the dike intrusion model also predicts slightly greater early subsidence than lithospheric stretching, but these differences are small. The metamorphism model (Falvey and Middleton, 1981) predicts an increase in heat flow until continental break-up (i.e., formation of oceanic crust) and subsequent decreasing heat flow, whereas the lithospheric stretching and dike intrusion models predict decreasing heat flow with time (Figure 1, Lerche, 1990).
These examples illustrate the importance of using geological and geophysical information to obtain an understanding of the mechanism(s) of basin formation before selecting a particular geodynamic model for a particular basin. Two basins with similar subsidence histories may have very different heat flow and thermal histories, and therefore, very different maturation levels and timing.
It has been difficult to test these models based on heat flow and subsidence data because differences in model predictions occur primarily within the early history of basin formation. Because early sediments are commonly not drilled in mature basins, early subsidence histories and maturity indicators can not be measured. Commonly, we can not estimate these histories even where early sediments have been sampled in mature basins because early subsidence measurements can be highly uncertain and early maturity indicators have commonly been over-cooked by subsequent heat flow (Royden et al., 1980). Subsidence and heat flow measurements of young rift basins have been studied, but subsidence in these basins is commonly not developed enough to calibrate the parameters of each model so that heat flow measurements can be tested (Royden et al., 1980). For example, in a study of the Gulf of Aden, Cochran (1982) was not able to distinguish between lithospheric stretching and dike intrusion models, even though this basin is only 10 My old.
Cooling Model Examples
The McKenzie model, its derivatives, and other cooling models have been applied with moderate success to numerous tectonic configurations where lithospheric stretching and/or heating has occurred, including passive margins, transtensional basins and intracratonic basins. We can use these models to predict first-order subsidence and heat flow for a basin with a degree of confidence that depends on the quality and quantity of our input data, and the degree that the model accurately simulates the tectonic processes and compensation mechanisms that operated during basin formation.
Basin subsidence of the northeastern U.S. margin began with rifting in the Jurassic approximately 200 My ago. Watts and Steckler (1981), Sawyer et al. (1982), and Steckler et al. (1988) determined parameters of a McKenzie model that best matched subsidence data of the COST B-2 well drilled offshore of New Jersey in the Baltimore Canyon trough. Sawyer et al. then used this McKenzie model to estimate the thermal and maturation history of the sediments within the Baltimore Canyon trough.
All parameters, (e.g., densities, solidus temperature, coefficient of thermal expansion and initial lithospheric configuration) other than the degree of stretching, β, were estimated based on known ranges in the values of these parameters, or on geophysical data. Based on seismic, gravity and magnetic data, the crust beneath this well is believed to be very thin, and composed of greatly thinned continental crust, transitional crust or oceanic crust. The following parameters were used in the model: crustal thickness was between 30 and 40 km, lithospheric thickness was between 120 and 125 km and rifting occurred between approximately 20 to 25 My ago.
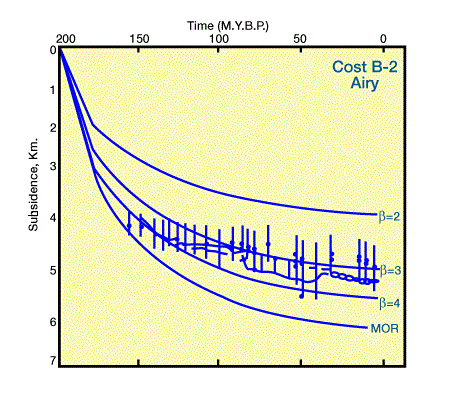
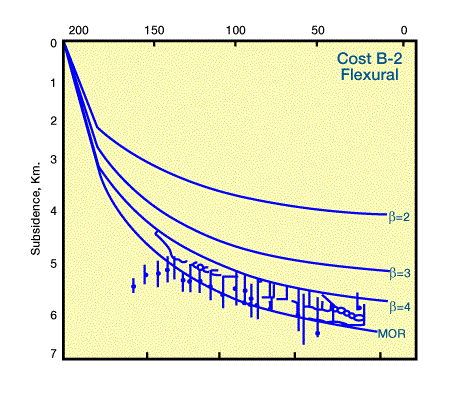
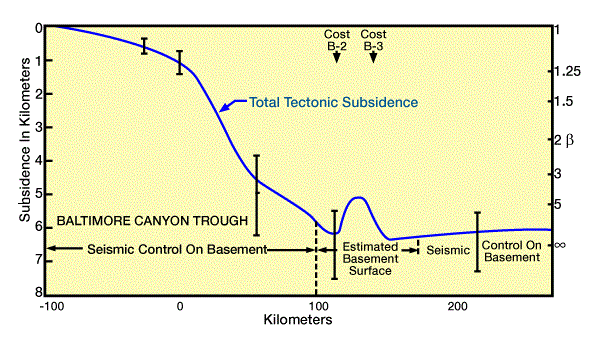
The stretching factor, β, was determined by finding the best match between theoretical and observed subsidence curves. Observed subsidence curves with error estimates were obtained by backstripping data from the COST B-2 using both Airy and flexural compensation models to remove the effect of sediment and water loading (Figure 1 and Figure 2).
Backstripping is a method for using stratigraphic data to separate subsidence caused by sediment and water loads from that caused by tectonic processes.
We must understand that we obtain a one-dimensional tectonic subsidence curve from backstripped stratigraphic data, and that backstripping is model-based because it requires a number of assumptions, including compensation mechanisms for sediment and water loading.
The McKenzie model was used to determine theoretical subsidence curves for several values of β. Because backstripping removes the influence of sediment loads, subsidence curves derived from backstripping are compared with water-filled, rather than sediment-filled, theoretical subsidence curves. Although Steckler and Watts (1978) and Sawyer et al. (1982) used slightly different assumptions for backstripping the same data and slightly different parameter values for estimating theoretical subsidence, their results are quite similar. Comparison of theoretical and observed subsidence curves suggests values for β of 3 to 3.5 using data backstripped with an Airy model, and β of 4 to infinity (i.e., no continental crust and formation of oceanic crust at a mid-oceanic ridge) using the same data backstripped with a flexural model. Based on gravity studies, present crustal thicknesses are more consistent with a value for β of 4 to infinity (Steckler et al, 1988).
Sawyer et al. (1982) estimated degrees of stretching across the margin at the Baltimore Canyon trough by backstripping other wells and estimating present depth to basement from seismic data (Figure 3 and Figure 4).
Using these estimates,
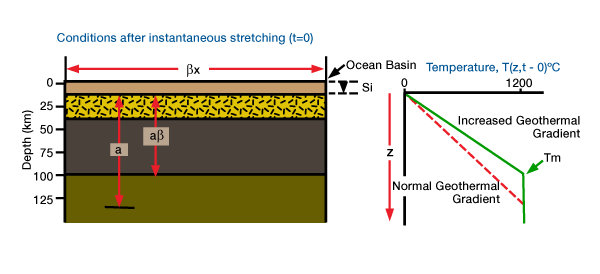
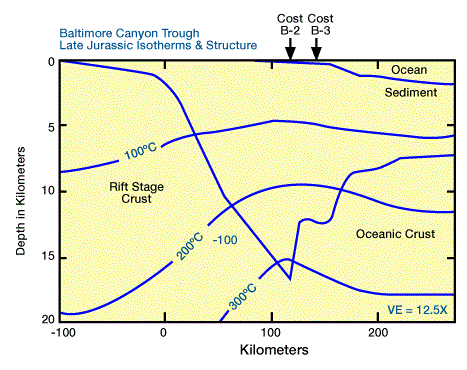
they determined the temperature structure across the margin immediately after rifting (Figure 4). By applying a two-dimensional conduction equation to this initial temperature structure together with predicted theoretical subsidence, they estimated the temperature structure history for the Baltimore canyon trough (Figure 5).
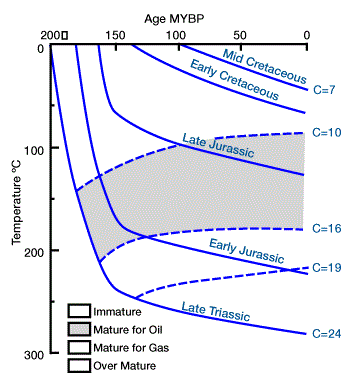
Finally, with a geochemical model, they used this temperature history to calculate a thermal alteration index for the sediments (Figure 6).
Potential sources of error in the accuracy of subsidence and heat flow predictions for a particular basin include incomplete and uncertain information, and the simplifications and approximations used in the model versus the complexity of real-world process/response systems. Our confidence in model predictions depends on the quality and quantity of information available to calibrate the model. We commonly estimate crustal densities and thicknesses from geophysical measurements (e.g., gravity and seismic) that may have low resolution for these parameters. Alternatively, if no geophysical measurements are available, we can choose values for these parameters from a range of typical values, although confidence in our results will decrease. For example, crustal densities may range from 2.78 gm/cm3 to 2.9 gm/cm3, resulting in a value of 700 m for initial subsidence for β = 2, and a value of more than 1 km for β = 4 (Cochran, 1982). Similarly, if initial crustal thickness estimations range from 30 to 35 km, initial subsidence values can range from about 600 m for β = 2 to 900 m for β = 4 (Cochran, 1982). We can not measure either lithospheric thickness, a, or solidus temperature, Tm, using geophysical data for a particular basin, and a 10 percent error in estimating these parameters results in a 10 percent error in predicting thermal subsidence, or approximately D200 m for β = 2 and D280 m for β = 4.
Because stretching and cooling models are most commonly calibrated to subsidence curves derived from stratigraphic well data, building an accurate model depends on the temporal and geographical sampling of these data. Increased time sampling of stratigraphic data potentially increases accuracy in determining the shape of a subsidence curve. Accurate reconstruction of tectonic subsidence for the entire basin also depends on the spatial distribution of wells. Increased well sampling of the basin increases our confidence in measured tectonic subsidence, and therefore, our confidence in a geodynamic model. In the Baltimore Canyon Trough example, no stratigraphic data were available for the first 50 My of subsidence history. Because the largest variations in heat flow and subsidence occur in the early history of a basin, stratigraphic data from the early history is particularly crucial for building an accurate stretching and cooling model. Using stratigraphic data from the COST B-2, Steckler et al. (1988) could not distinguish between models for instantaneous rifting, finite rifting and maximum heating (i.e., a model with subsidence rates equal to those associated with oceanic crust formation).
We commonly calibrate stretching and cooling models using model-based analyses, particularly geohistory, or backstrip analyses. Model-based analyses are uncertain because they are also derived from incomplete and uncertain information, assumptions about model parameters and approximations of processes. For example, the error bars in measured subsidence for the COST B-1 well limit the accuracy with which we can determine parameters of a McKenzie model (Figure 1 and Figure 2). Sawyer et al. (1987) and Steckler et al. (1988) calculated different values for measured tectonic subsidence because they used different model approximations when they backstripped the data. The type of compensation mechanism used (local or flexural) resulted in considerable differences in estimated stretching factors.
When building stretching and cooling models, we must approximate and simplify actual tectonic processes. There is a trade-off between model simplification and the degree of confidence in our model predictions. If our model is too simple, we can not adequately model the actual tectonic processes and our predictions will be inaccurate. For example, even though heat flow is actually three-dimensional, we commonly use a one-dimensional conduction equation to calculate heat flow and thermal subsidence in cooling models. During the early history of basin formation, this assumption may be inadequate. If heat flow is altered by the cool basin flanks, the temperature structure will not be laterally uniform. As the basin matures, the temperature structure becomes more uniform laterally. So, errors due to the assumption of one-dimensional heat flow should decrease with time. Processes may also operate during basin formation that may strongly influence heat flow and thus subsidence, including other heat sources such as radioactivity in sediments or crust, the alteration of heat flow due to thermal blanketing of sediments, or convection.
The choice of compensation mechanism has a large effect on predicted subsidence. Cooling models most commonly use an Airy compensation model because we assume lithospheric rigidities to be low due to thermal events. As the basin matures, the lithosphere cools and becomes more rigid, and an Airy model may not accurately predict subsidence. Consequently, errors due to the assumption of Airy compensation should increase with time during basin formation. Alternatively, neither Airy nor flexural models may be adequate if inhomogeneities within the lithosphere influenced load compensation.
 Petro Shine The Place for Oil and Gas Professionals.


