Related Articles


Electrical Anisotropy
Electrical anisotropy exists when the resistivity of a formation varies with the direction. This form of anisotropy is seen as a variation between the resistivity measured parallel to the formation’s bedding plane, the horizontal resistivity, Rh, versus the resistivity measured perpendicular to the bedding plane, the vertical resistivity, Rv.
Anderson et al. (1997) links the cause of electrical anisotropy to the same factors that cause permeability anisotropy:
- Formation bedding geometry
- Grain size in homogeneous sandstone beds
These correspond to two important types of low resistivity pay:
- Formed by thin-bedded or laminated sandstone and shale sequences
- Formed by sandstone layers of varying grain size distribution or sorting, which can produce variations in the water saturation, the morphology of the conductive fluid, or the distribution of fluid phases
In laminated shaly sandstones, the thin shale layers do not significantly alter the porosity and permeability characteristics of the interbedded sandstones. However, in such reservoirs, the horizontal resistivity is governed by the conductive shaly laminae of the formation. This is because the highly conductive nature of shales suppresses the response of some conventional induction logging tools, which measure the current flow parallel to the shale beds.
Measurement of the electrical anisotropy, by acquiring both vertical and horizontal resistivity measurements, provides a valuable tool for obtaining better estimates of the formation hydrocarbon saturation. Knowledge of the vertical resistivity and the horizontal resistivity obtained from today’s higher technology logging tools can play a crucial role in evaluating low resistivity pays.
Vertical and Horizontal Resistivity
To properly characterize shaly sandstone reservoirs, it is important to understand the relationship between the resistivities and the laminar shale volume. Mollison et al. (2000) illustrate this by modeling a laminar shale formation comprising 50% thinly bedded sandstones and 50% shales (Figure 1). The sandstones in this model had resistivities of 10 ohm-m, and the shales had resistivities of 1 ohm-m.
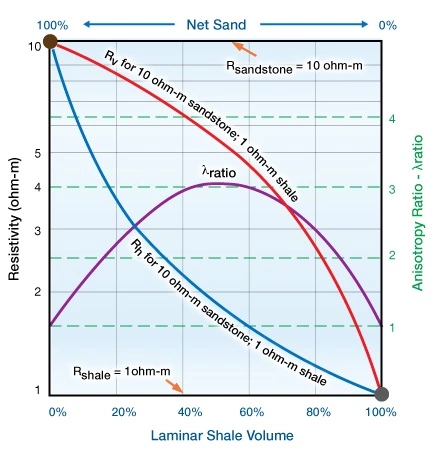
The vertical and horizontal resistivities, Rv and Rh respectively, are plotted as a function of the laminar shale volume Vshale. The equations used in this model for the computation of both Rh and Rv, as a function of laminar shale volume Vshale, and the anisotropy ratio are:


Where:
Rh= horizontal resistivity
Rv= vertical resistivity
Rsand= sandstone resistivity
Rshale= shale resistivity
Vsand= laminar sandstone volume
Vshale= laminar shale volume
λratio= anisotropy ratio
Modeled Behavior
The maximum separation between the vertical and horizontal resistivity occurs at a 50% laminar shale volume, where the electrical anisotropy ratio,  , reaches its maximum value.
As the laminar shale volume increases from 0% to 30%, the horizontal resistivity decreases very rapidly. For laminar shale volumes over 30%, the horizontal resistivity exhibits a lower sensitivity to changes in the shale volume. When the laminar shale volume exceeds 30%, the horizontal resistivity, Rh, shows less sensitivity to variations in the laminar sandstone-shale resistivity, thus increasing the difficulty of detecting thin bedded, resistive sandstones that contain hydrocarbons.
The vertical resistivity is a volume-weighted average of both the sandstone and the shale resistivity components and shows a much more gradual reduction as the laminar shale volume increases. Mollison et al. (2000) note that the vertical resistivity, and, most importantly, the resulting anisotropy ratio are sensitive to changes in both the laminar shale content and the laminar shale resistivity throughout the entire range from 0% to 100% shale volume. Therefore, the vertical resistivity measurement is more sensitive to the presence of hydrocarbon-bearing laminated sands within the sandstone and shale sequence.
In Figure 2, Mollison et al. take the model from Figure 1 a step further to illustrate the limitations of horizontal resistivity sensitivity. A shale having 1 ohm-m resistivity is again used in this laminated sandstone and shale model, and the horizontal resistivity is calculated versus the laminar shale volume for two laminar sandstones having resistivities of 5 ohm-m and 10 ohm-m, respectively.
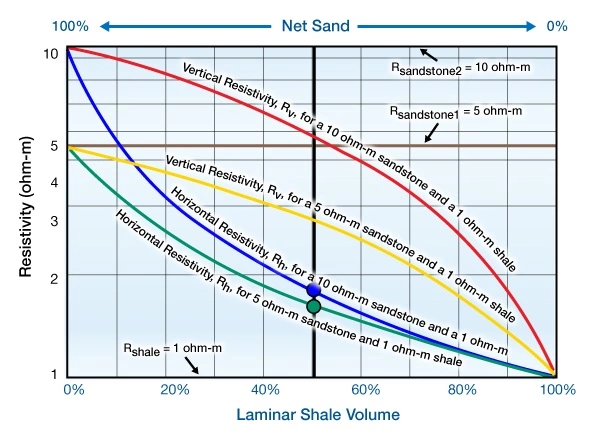
In this model, a laminar shale volume of 50% is able to suppress the horizontal resistivity in the 10 ohm-m sandstone to 1.8 ohm-m. Similarly, the horizontal resistivity in the 5 ohm-m sandstones is suppressed to 1.65 ohm-m. On the basis of the horizontal resistivity alone, these two sandstone and shale sequences would be practically indistinguishable at a 50% laminar shale volume, with a minute difference of approximately 0.15 ohm-m between horizontal resistivity readings, which is typical of low contrast pays.
By contrast, the vertical resistivity shows significantly higher values over the horizontal resistivity readings. At a 50% laminar shale volume, the 10 ohm-m sandstone yields a vertical resistivity reading of 5.5 ohm-m, while the 5 ohm-m sandstone at 50% shale volume yields a vertical resistivity of 3 ohm-m. In this situation, we see that vertical resistivity changes by 2.5 ohm-m with the same sandstone and shale composition.
We can draw an important distinction between the performance of the horizontal and vertical resistivities. We see only a small difference in the horizontal resistivity, Rh, between the laminated sandstone and shale sequences. Conversely, the vertical resistivity, Rv, is very sensitive to the sandstone pore fluid content. Sensitivity remains high even when the sandstone fraction drops as low as 20%. In summary, the availability of vertical resistivity data can greatly improve the evaluation of the hydrocarbon saturation in thin bedded or laminar sandstone and shale sequences.
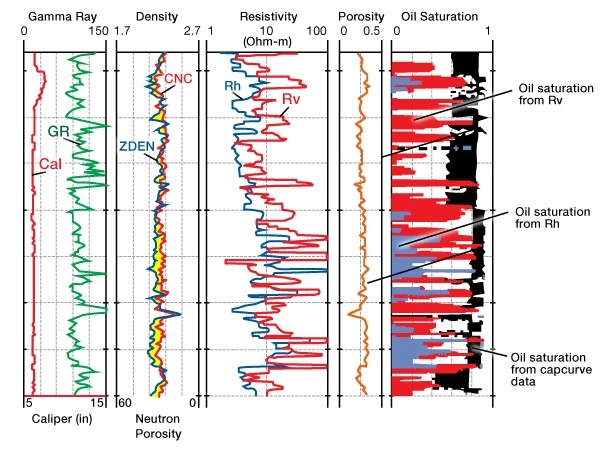
Figure 3 illustrates how much the vertical and horizontal resistivities, shown in track 3, affect the oil saturation calculations, shown in track 5.
Other Instances of Electrical Anisotropy
Thinly laminated sandstone and shale sequences are not the only cause of electrical anisotropy. This phenomenon can also be caused by other structural and sedimentary factors.
Apparent Dip
Electrical anisotropy is the difference between the resistivity measured parallel to the bedding plane versus the resistivity measured perpendicular to the bedding plane.
Because the electrical anisotropy depends on the direction in which electrical current flows in the rock, both the angle at which the borehole penetrates the formation and the dip of that formation are important factors. In geological terminology, this is called the apparent dip, which is defined as the angle that a plane or wellbore makes with the horizontal, measured in any randomly oriented section rather than perpendicular to the strike.
Anderson et al. (1994) notes that the extent to which anisotropy affects the well log resistivity reading will depend on the angle between the borehole and the formation. When a vertical well drills through a flat formation or bedding plane, conventional induction logging tools will measure the horizontal resistivity.
Measurements of resistivity show that the current flowing normal to the bedding, the vertical resistivity, is always at least as much as, if not more than, the horizontal resistivity. As the wellbore deviation increases, the contribution from the vertical resistivity becomes stronger.
Differences between the Oil and Water Legs of a Reservoir
Allen, Klein, and Martin (1995) reported that water-wet formations with large variability in their grain size can be highly anisotropic in the oil column while being isotropic in the aquifer below. They attribute the electrical anisotropy to grain size variations, which affect the irreducible water saturation.
Figure 4 displays the results of the experiment by Allen, Klein and Martin (1995), which shows how hydrocarbon saturation influences the electrical anisotropy.
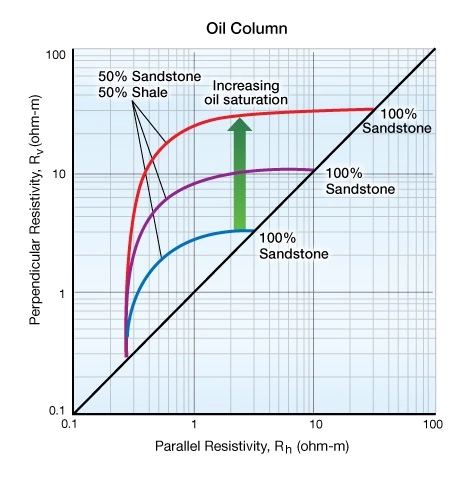
Figure 5 illustrates the influence of water saturation.
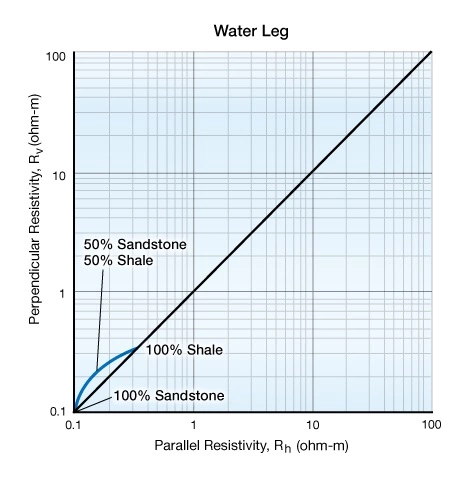
Using these two graphs, we can compare plots of the perpendicular resistivity versus the parallel resistivity measured within a reservoir oil column and a water column. The resistivity model shows that resistivity readings in the oil column arc sharply to the right, while resistivity values in the water column only take a slight bend. The position of data along the oil column arc indicates the sandstone/shale content of the formation. In the oil column, a strong anisotropy is developed as the saturation of the more resistive oil increases. In the water leg, however, the same formation might display little, or no, anisotropy.
Differences in Grain Size
Electrical anisotropy can also result from changes in the grain size that affect the saturation distribution, as well as from shaliness. Significant resistivity anisotropies of 10:1, or greater, have been found in what were previously assumed to be clean, homogeneous sandstones. In these formations, the anisotropy is thought to be due to contributions from variations in the grain size, irreducible water saturation or permeability.
Similarly, electrical anisotropy in the invaded zone of the formation can be different from that in the uninvaded zone (Anderson et al., 1994).
