Related Articles

Hole Cleaning Considerations
It is very difficult to model the hole cleaning process during foam drilling because of the complex foam rheology. Moreover, the foam quality is a strong function of pressure, and the inflow of the formation fluid is an unknown most of time. Liquid inflow reduces the foam quality leading to a loss of viscosity and an increase in density.
Rheology
Foam flow behavior is mainly controlled by quality and flow rate. The overall viscosity is independent of the foaming agent’s concentration. Regulating the quality controls the effect of temperature and pressure on rheology. Mitchell (1971) investigated foam rheology and concluded that foam was effectively a Newtonian fluid at qualities up to 55 percent. The viscosity of foam for these qualities is given by:
Equation 1

where:
μF = foam viscosity, cp
μL = liquid viscosity, cp
Γ = foam quality, fraction
Foams with qualities greater than 55 percent can be modeled using the Bingham plastic model:
Equation 2

where:
τ = shear stress, lbf/ft2
τy = yield point, lbf/ft2
γ= shear rate, 1/s
PV = plastic viscosity, cp
In Mitchell’s study (Figure 1 (Foam viscosity and yield stress as a function of foam quality)), both plastic viscosity and yield point increase with increasing quality, up to 96 percent; the highest quality studied.
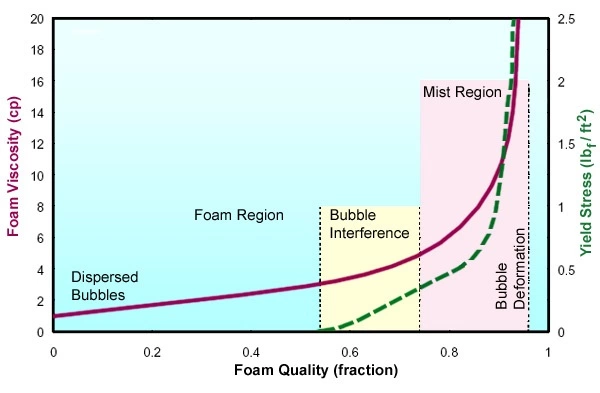
Plastic viscosity ranges from less than 4 cp at 60 percent quality, to more than 15 cp at around 96 percent quality.
Other investigators have found that better rheological modeling can be conducted using a power law model:
Equation 3

where:
τ = shear stress
γ = shear rate
K = consistency index
n = flow behavior index
K and n are determined experimentally. According to the experimental results published by Sanghani and Ikoku (1983), viscosity increases with increasing quality up to 94 percent foam quality. Beyond this point, viscosity decreases with increasing quality.
The pressure drop within the wellbore is strongly influenced by foam viscosity and quality. Numerical models can be used to predict the circulating pressure in foam drilling. Charts were developed using the model of Krug and Mitchell, which is for a laminar flow of a Bingham plastic fluid through a pipe. They estimated the air and liquid volumetric injection rates and pressures for conditions that would represent practical limits for efficient downhole cleaning. Figure 2a.
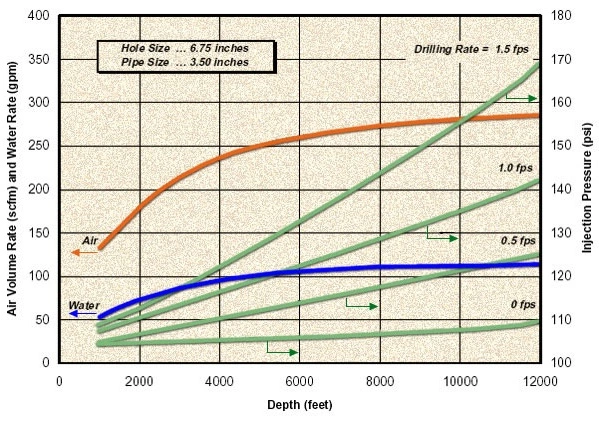
and Figure 2b show an example of recommended air and liquid injection rates for different hole and pipe sizes, as calculated by Krug and Mitchell, 1972).
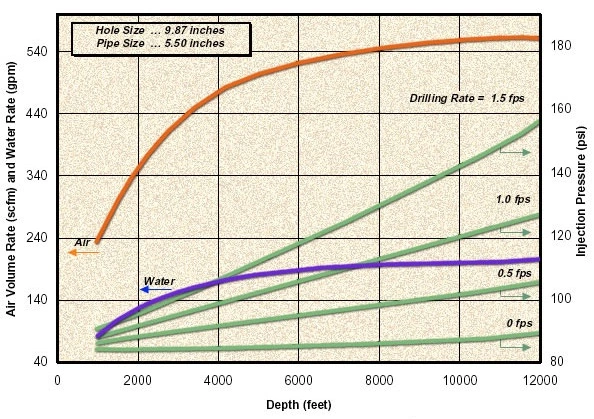
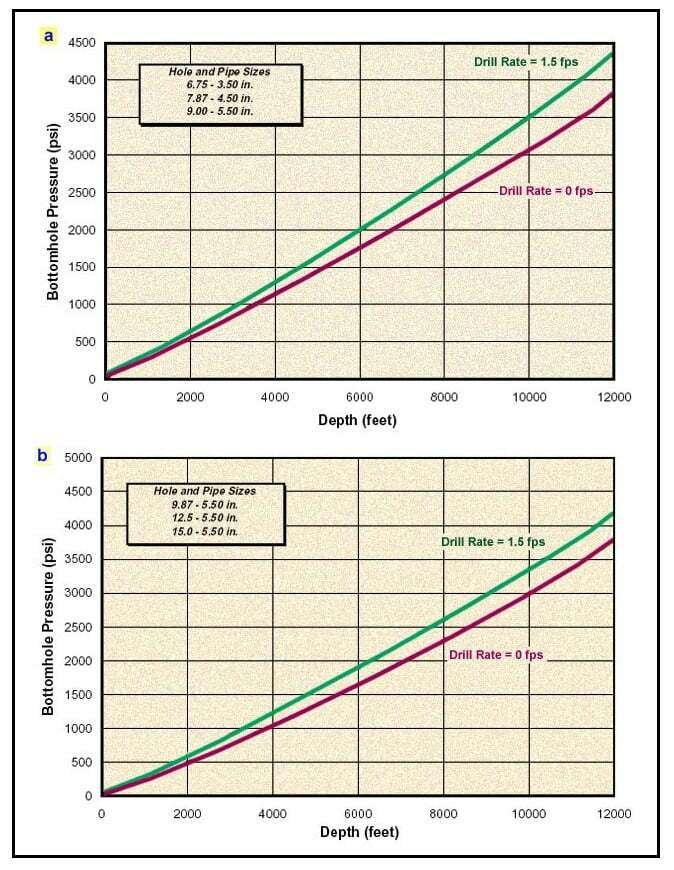
Figure 3a and Figure 3b show the bottomhole pressure prediction charts with no inflow.
Beyer et al. (1972) developed another foam circulation model using the data with foam qualities ranging from 75 to 98 percent. Their model assumes that there are no cuttings in the annulus and that cuttings do not interfere with the foam quality. The effect of foam slippage and eccentricity of the drillstring are included in this model. According to field test results, the difference between predicted and measured pressures was less than 10 percent.
Lord’s model (1979) is basically an equation of state for foam. It can estimate the foam density as a function of pressure, temperature, liquid density and gas mass fraction assuming real gas behavior. The friction factors computed at the inlet and outlet are used to estimate a constant friction factor for the entire system. The model requires an iterative numerical solution to predict the downhole pressures.
Okpobiri and Ikoku (1986) have developed a foam circulation model that includes the effects of pressure drop at bit nozzles and annular pressure drop due to cuttings. This model accounts for the settling of cuttings within the foam. Even though the pressure drop at the bit was included in their model, Okpobiri and Ikoku showed that the overall effect is small compared to other pressure losses.
Guo et al. (1995) have developed a simpler method of predicting downhole pressures. Their iterative method calculates the bottomhole pressure and foam quality based on foam velocity and effective viscosity. It does not account for the presence of cuttings in the annulus. Therefore, it predicts lower bottomhole pressures compared to those predicted by Okpobiri and Ikoku.
The reason for implementing foam drilling as opposed to dry gas is the capability of handling large formation fluid inflows. Most of the models described above do not include the effect of fluid inflow. Considering the typical liquid injection rates during foam drilling, a water inflow can significantly change the foam quality at all points in the wellbore.
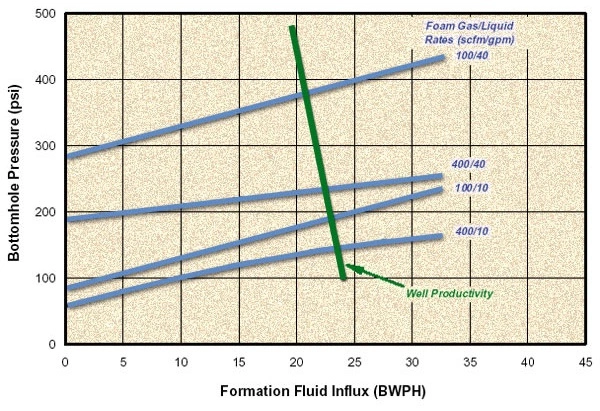
Milhone et al. (1972) improves the model of Beyer et al. (1972) by demonstrating the effect of water inflow on bottomhole pressure. They observed an increase in bottomhole pressure, with increasing water inflow rates as shown in Figure 4.
A recent model by Liu and Medley, (1996), predicts the pressure profile and foam quality by solving the mechanical energy balance and incorporating inflow of liquid and gas.
Cuttings Transport
The high viscosity of foam increases the efficiency of cuttings transport. Figure 5 developed by Beyer et al.
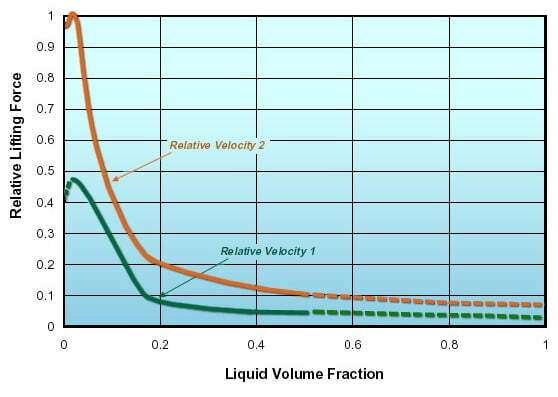
illustrates the relative lifting forces as functions of foam quality for different velocities. As shown, most of the increase occurred as the quality is increased beyond 80 percent.
Rankin et al. (1989) compared the transport capabilities of different lightened drilling fluids and water were compared with a model horizontal well. The results showed that an annular foam velocity of 100 ft/min is adequate to lift sand in the horizontal section, as opposed to an annular velocity of 2,500 ft/min for dry air and 300 to 400 ft/min for water.
Efficiency of cuttings transport is analyzed by comparing the upward velocity of drilling fluid with the settling velocity of cuttings. In air drilling, the flow regime is always turbulent. However, this is not necessarily the case for foam. Moore (1974) estimated the terminal velocity of cuttings for laminar, transitional and turbulent flow regimes. His calculations are based on experimental data for limestone and shale cuttings flowing through mixtures of water and glycerin.
Equation 4

where:
Re = Reynolds’ number
μc = effective fluid viscosity, cp
ρf = drilling fluid density, ppg
dc = cuttings diameter, in
vf = terminal cuttings velocity, ft/min
If flow is laminar, the terminal velocity increases with increasing foam quality, until foam breaks down into mist.- If the flow is turbulent, the terminal velocity is independent of the foam’s viscosity and it increases with increasing foam quality due to the reduction in density.
- In transitional flow, the terminal velocity is highly dependent on the density difference (cuttings and foam) and the effective foam viscosity.
All the cuttings transport models require that the cuttings size be known before generating a prediction.
The best foam drilling design charts, similar to Angel’s dry gas drilling model, are the charts from Krug and Mitchell (1972). An example chart is given in Figure 2a. The chart is used to estimate the air and water volume requirements for an annular bottomhole velocity of 90 ft/min, no back pressure and a surface foam quality of 96 percent. Bottomhole pressures calculated according to this technique are shown in Figure 3a and Figure 3b.
The overall conclusions obtained from these models are:
- Air and liquid injection rates increase with increasing drilling depth
- Injection pressure increases with an increased penetration rate
- Higher quality foams typically lead to lower bottomhole pressures
- In order to maintain the foam quality at the desired level as the well depth increases, back-pressure needs to be applied to the returning flow.
Summary
Foam drilling is used when water inflow is anticipated. In order to achieve efficient cuttings transport, the annular velocities have to be kept at a relatively low rate (~100 ft/min). Moreover, foam drilling generally requires lower compression power, compared to dry and mist drilling methods.
Circulating foam can effectively handle large inflows of formation water. The air injection rate has to be increased in order to keep the foam quality within acceptable limits. However increasing the air injection rate tends to offset the increase in bottomhole pressure. In case of gas inflow, pumps should be able to deliver adequate volumes of liquid to keep the foam quality below 98 percent.
A good foam drilling design should assume around 60 percent minimum downhole foam quality with an annular velocity of 100 ft/min. Foam qualities can be controlled within the wellbore by adjusting the annular back-pressure.