Related Articles


Archie’s Equation
This section reviews the use of the Archie equation for estimating the water saturation of a clean formation. Once determined, the water saturation can be used to indicate whether hydrocarbon or water production, or both, is anticipated from a completed zone, and to estimate the original hydrocarbons in place, STOOIP and GIIP.
The water saturation is defined as that fraction of the pore volume occupied by water, as shown in Figure 1.
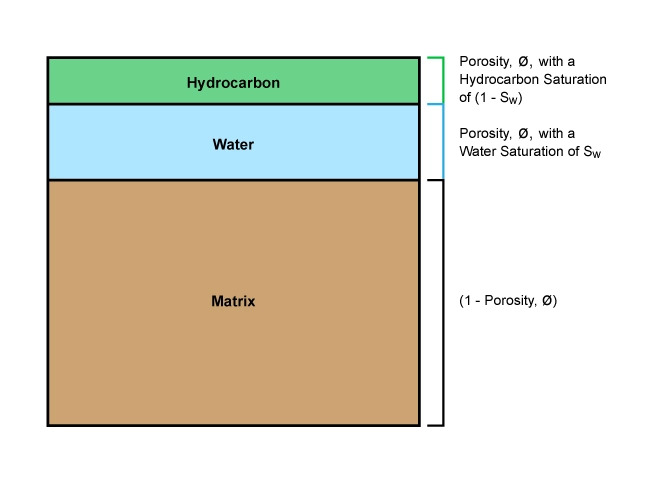
The bulk volume of water in a unit volume of porous rock is given by the product ϕ×Sw, and the bulk volume of hydrocarbons is given by ϕ×(1−Sw). These input data are used to establish the hydrocarbon pore volume (HPV) of a reservoir.
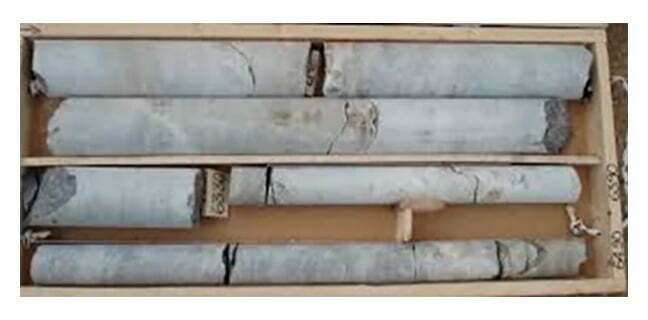
Two methods for determining the water saturation of a rock sample are by the analysis of full diameter core (Figure 2) and by well log analysis. However, only native state cores drilled with oil base mud can be relied upon for representative water saturation, Sw, values. As regards the role of measurements of the permeability from full diameter cores, several low resistivity pay sections with very high apparent water saturations do, on well completion, produce water-free hydrocarbons. Since these are generally formations of low permeability, core analysis can help to evaluate such formations.
Application of Archie’s Equation
Archie combined three measurable observations into one equation. By saturating a rock sample with solutions of different salinities, he found that the resistivity of the water-saturated rock, Ro, was related to the resistivity of the saturating formation water, Rw, by the equation:

Where:
F= the formation factor
Ro= resistivity of the water-saturated rock
Rw= resistivity of the formation water
The formation factor was found to vary predictably as the rock porosity changed according to the equation:

Where:
a= a constant
ϕ= porosity
m= cementation exponent
Formations with less than 100% water saturation and a resistivity of Rt were found to relate to the equation:

Where:
Sw= water saturation
n= saturation exponent
Ro= resistivity of the water-saturated rock
Rt= resistivity of the uninvaded formation
Combining these relationships gives the full Archie equation for estimating the water saturation:

The values of a, m and n can be temporarily set to typical values for the formation type in question, pending special core analysis (SCAL) studies to determine their values for the actual formation.
Some widely used values for these constants and the related formation-factor-to-porosity relationships are:
For sandstones:
a=0.81 m=2 n=2
or
a=0.62 m=2.15 n=2
For carbonates:
a=1 m=2 n=2
Consequently, three commonly used versions of Archie’s equation are:
For sandstones:

or

or, for carbonates:

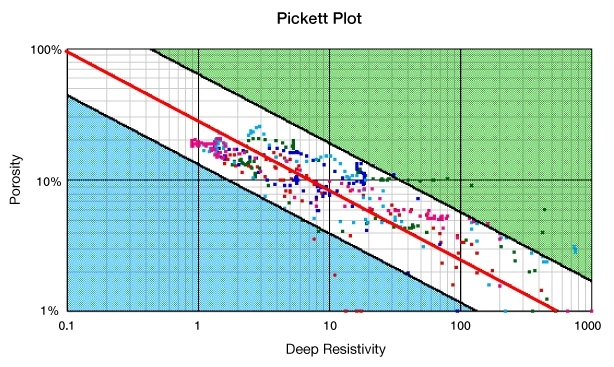
The log analyst should try to avoid routinely using these values for generic rock types for a, m and n in all evaluations of conventional reservoirs. Some crossplot methods, such as the Pickett plot (Figure 3), which is a graphical solution to the Archie equation achieved by plotting the porosity versus the resistivity on a log-log grid, allow one of these parameters to be deduced at a time. The Pickett plot uses a pattern recognition approach to solving Archie’s equation without the need for knowing all the constants. A benefit to such a pattern recognition approach is that the water saturation can be derived without having any calibration data for the porosity measuring device, such as the grain density, as well as not having to know the resistivity of the formation water. There must be a statistically significant number of zones plotted in order to provide accurate calculations. The unknown constants in Archie’s equations must be relatively constant for each interval analyzed.
However, there is no substitute for rigorous, full diameter core analysis to determine the actual parameters for each reservoir zone. While the saturation exponent, n, is usually initially assumed to be 2, its exact value may vary depending on rock wettability. Oil-wet systems usually have an n parameter value greater than 2. Some water-wet systems show an n parameter value less than 2.
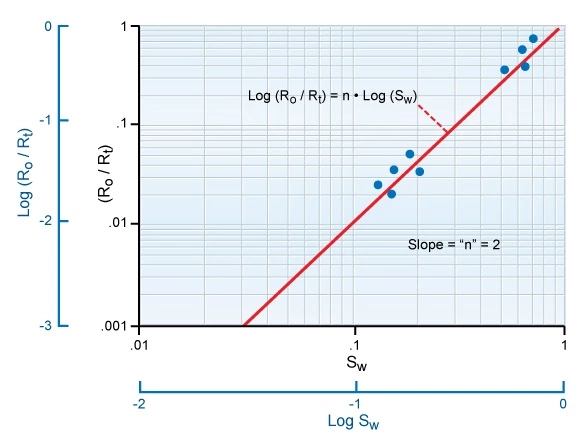
To determine the saturation exponent, n, a core sample is prepared at a number of different water saturations, and for each saturation, the ratio of Ro to Rt is measured. By taking the logarithm of Archie’s equation, it is transposed into:

Therefore, a plot of log Sw versus log (Ro/Rt) should produce a straight line of slope n (Figure 4).
It is worthwhile to explore the sensitivity of the water saturation, Sw, to the value used for n. Suppose a calculation of the water saturation is made using n= 2, and the resulting value of Sw is 0.5, or 50%. Then, we can deduce:

Thus:

Having found that  is 0.25, we can now run a scenario of raising the parameter n to 2.2:

Lowering the saturation exponent, n, to 1.7 gives:

In summary, providing all other factors remain the same, raising the value of the saturation exponent, n, raises the calculated water saturation; lowering the value of n lowers the water saturation.
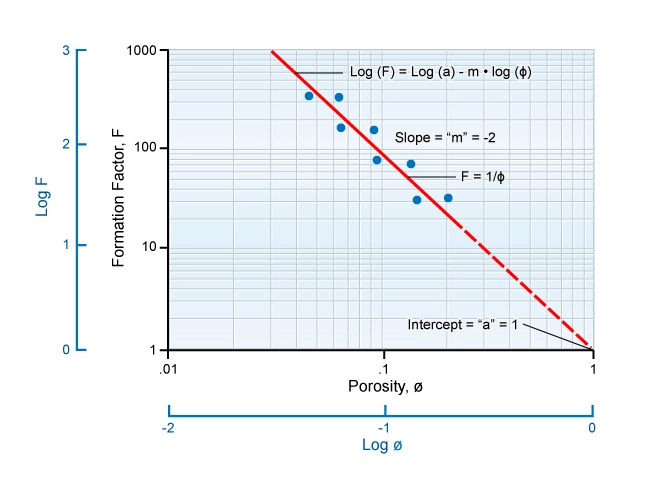
Each rock type has its characteristic formation factor-to-porosity relationship. Core measurements to determine this relationship require a range of core samples of different porosities. For each of these porosities, a measurement is made of Ro, the resistivity of the rock at 100% water saturation. If the value of Rw is known, the formation factor, F, can be deduced by using the equation  . The solution used to saturate the core should be of the same salinity as that of the water in the formation. By taking the logarithm of both sides of the equation that relates formation factor to porosity, the result is:

Thus, a plot of logF versus log porosity should give a line a slope of −m and an intercept at ϕ= 1 of a (Figure 5).