Related Articles


Multiphase Vertical Flow
Many different flow regimes may exist in multiphase flow. In an oil well, two or three phases of fluid may be present in the producing interval. If the flow is water and oil, bubble and emulsion flows are most common, while slugs and more complex patterns are relatively rare. If the slug pattern exists downhole, it appears as a square wave pattern on the flowmeter log, since the oil slugs are moving up at a higher velocity than the water phase. When gas and liquid are present, the flow is much more complex. Bubble flow probably exists up to about 10% gas by volume at downhole conditions. A transition quickly occurs to the slug or more complex flow pattern. Unlike oil-water flow, gas-liquid flow is turbulent and violent, and produces a very ratty response on the flowmeter. This messy situation continues until the gas flow rate and volume fraction is so large that it carries the liquid uphole as a mist. As a result, flows containing gas and liquid may be difficult to compute accurately.
The terms “holdup” and “cut” are often misunderstood. “Cut” refers to the amount of a particular phase that is being produced. For example, if 1000 B/D (159 m3/D) of liquid is produced, of which 350 B/D (55.6 m3/D) is water, the liquid is said to have a 35% water cut and a 65% oil cut. “Holdup,” on the other hand, refers to the fraction of the bulk volume occupied by one of the phases. Figure 1 helps illustrate this concept.
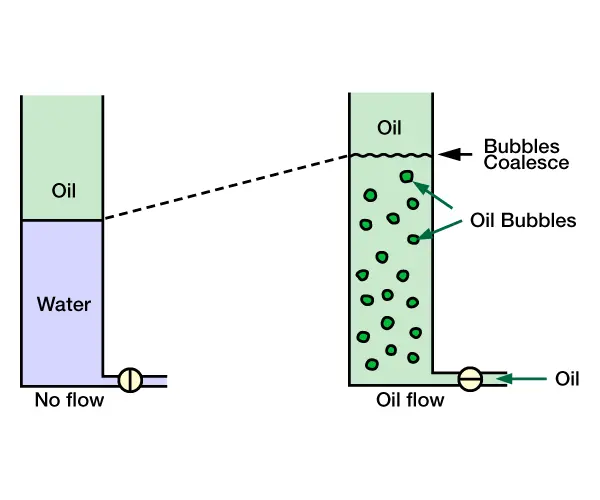
At the left, there is a standing water column in the pipe, above which the pipe is filled with oil. The valve at the bottom is then opened and oil only is pumped in. Flowing out at the top is 100% oil cut with no water cut. The oil simply bubbles up through the water and joins the other oil at the oil/water interface. No water is produced. Across the bubbly interval, the bubbles occupy about 30% of the volume (determined from the new position of the interface) , and hence that interval is said to have an oil holdup of 30% and a water holdup of 70%. The cut and holdup in this case are clearly different.
Because of this difference, water is likely to accumulate downhole in all wells, even though the water cut is small. The chart of Figure 2 shows how the difference between holdup and cut can be quite dramatic, especially at low flow rates.
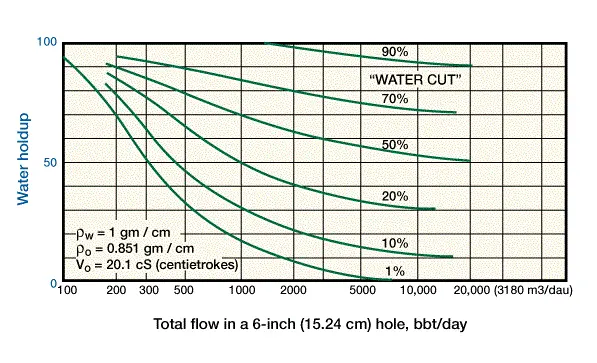
Note that at 300 B/D (47.7 m3/D), a 1% water cut at the surface means a 50% water holdup downhole.
If two phases are present (a heavy and a light phase), then
YH+YL=1.0 (1)
where Y is the symbol for holdup and the subscripts refer to the heavy (H) and light (L) phases. If water and oil are flowing downhole, water is the heavy phase, and if gas and liquid are flowing, the liquid is the heavy phase. If the three phases water, oil, and gas are present, then
Ywater+Yoil+Ygas=1.0 (2)
Measurement of Phase Holdup
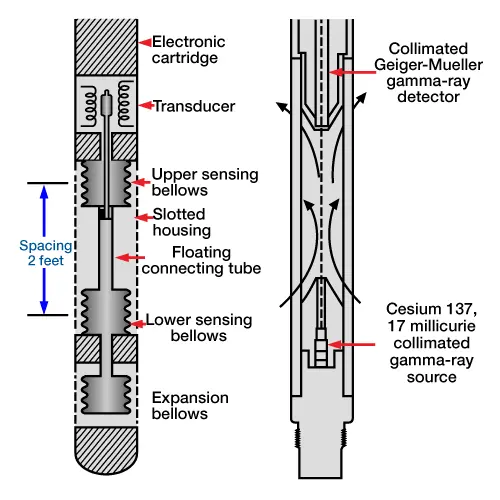
Measurement of phase holdup in two-phase flow is made indirectly by measuring the fluid bulk density. Schlumberger’s gradiomanometer and PTS sonde measure bulk density by determining the pressure differential over about a 2-ft (0.61-m) interval. This measurement is made with mechanical sensing bellows on the gradiomanometer, or by a quartz differential pressure gauge measurement over about a 2-ft interval. A schematic of the gradiomanometer is shown on the left side of Figure 3.
Note that these tool responses must be corrected for well-deviation angle.
Bulk density is also measured using the nuclear fluid density meter, as pictured on the right of Figure 3. The tool contains a gamma ray source and a detector, and the counts received at the detector may be related to the density of the fluid between the two. This measurement of the bulk density does not have to be corrected for the well-deviation angle.
To determine the holdup from the bulk fluid density, the following equation is used:

and
YH+YL=1.0
In the above equations, ρ symbolizes the fluid density, gm/cc.
Capacitance devices for fluid identification are also available. Their best measuring range is from about 0 to 40% water holdup. These tools are designed to measure annular capacitance between the tool housing and a core within the housing. Fluid turbulence downhole is the mechanism that pushes the multiphase fluid into the tool. There is some question about whether the fluid mixture within the tool is representative of the fluid mixture in the main flow. The capacitance tool is mainly responsive to water.
Computation of the Two-Phase Flow Profile
Once the bulk flow rate and the holdup of the two phases are measured, the slippage velocity must then be determined. This slippage velocity is the velocity of the light phase relative to the heavy phase, and is the cause of the difference between cut and holdup. To determine the slippage velocity between oil and water, use the chart in Figure 4.
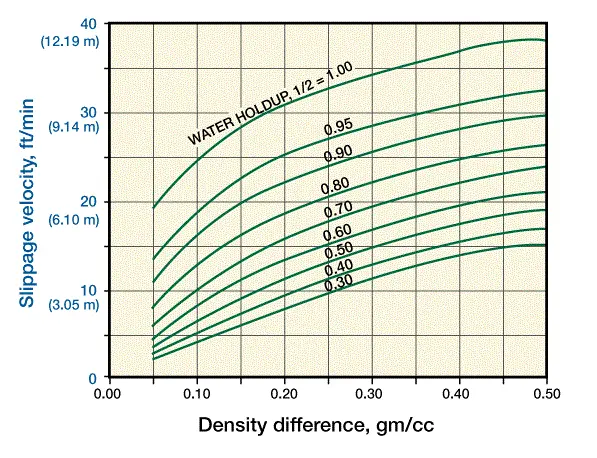
The horizontal axis is the density difference between the water and the oil phases (note that this chart is not used for gas/liquid mixtures). The holdup of the water phase is also needed for the use of this chart. For example, if the water density is 1.0 gm/cc and the oil density is 0.70 gm/cc, the density difference on the chart is 0.30 gm/cc. If the water holdup is 0.70, then the slippage velocity of the oil with respect to the water is about 19 ft/min (5.8 m/min). When dealing with a gas/liquid system, a slip velocity of 60 ft/min (18.3 m/min) is assumed. Better estimates of the gas slip velocity may be available from the service companies.
To compute the flow rates for each interval, in two-phase flow, the following equations are used:
![Q _{H_{i}} = Y_{ H_{i}} [Q_i - 1.4(ID_{casing}^2 - D_{tool}^{2} )(V_{slip_{i}})(1 - Y_i)]](https://petroshine.com/wp-content/ql-cache/quicklatex.com-b91796a754b936cd3f6697fc7efea777_l3.png "Rendered by QuickLaTeX.com")
or, in SI units,
![Q'_{H_{i}} = Y_{H_{i}} [Q_{i} - 0.113({ID'}_{casing}^{2} - {D'}_{tool}^{2})(V'_{slip_{i}})(1 - Y_{i})]](https://petroshine.com/wp-content/ql-cache/quicklatex.com-c7e393a274e91bdee9e1e1ce003d1718_l3.png "Rendered by QuickLaTeX.com")
and

or, in SI units,

where:
Q= bulk flow rate from the flowmeter, BD (Q′ is in m3/D)
QH= heavy phase flow rate, B/D (Q′H is in m3/D)
QL= light phase flow rate, B/D (Q′L is in m3/D)
YH= heavy phase holdup
Vslip= slip velocity of light phase, ft/min (V′slip is in mmin)
IDcasing= internal diameter of the casing, in. (ID′ is in centimeters)
Dtool= tool diameter, in. (D′tool is in centimeters)
i= subscript denoting interval under analysis
Individual entries are determined by the differences between the flow rates measured above and below an entry.
