Related Articles


Core Analysis Report
Best practices comprehensively document the core analysis processes and include these in the core analysis report, as in the example below:
Porosity Determination
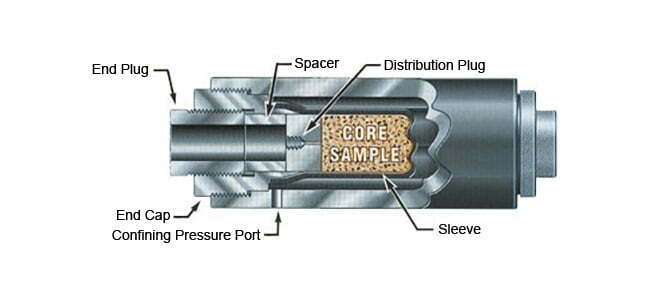
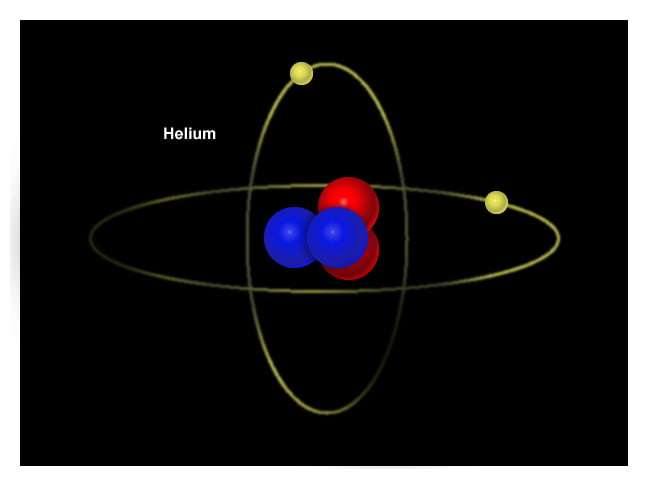
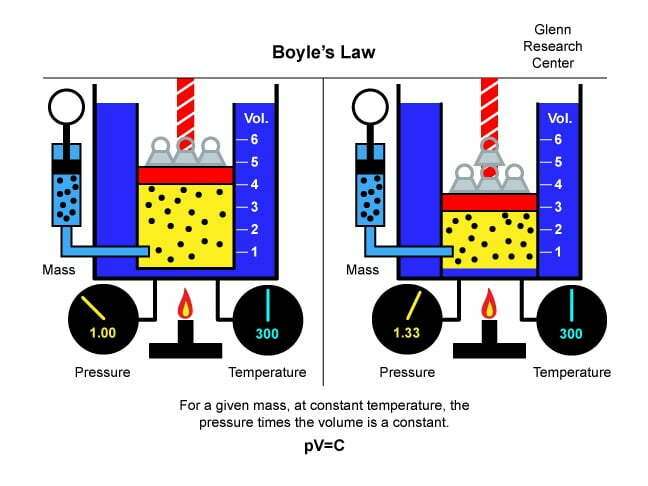
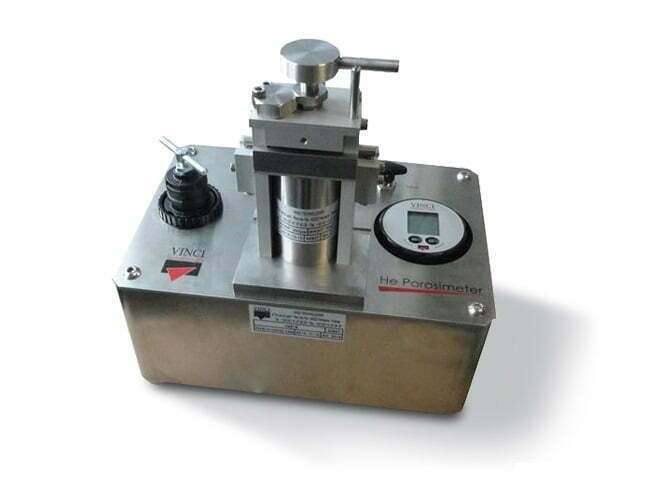
The samples were loaded into a Hassler (Core Laboratories, 2014) (Figure 1) core holder (Hassler core holders have radial pressure applied to the core sample) at a confining pressure of 200 psia. Direct pore volume measurements were made using Boyle’s Law methods with helium (Figure 2) as the gaseous medium (Smithson, 2012). The Boyle’s Law (Figure 3) technique for measuring a rock sample’s porosity is a gas transfer method that involves the compression of gas into the pores, or the expansion of gas from the pores, of a clean, dry rock sample. It is an accurate technique when it has been performed carefully, as in this case; it is also a reasonably quick process for the majority of typical core samples. It leaves core material that can be used for further testing. Samples were clean and dry, thus avoiding erroneously low porosity values being generated.
Appropriate screen pore volume tares were applied to each sample. Porosity was calculated using the following equation:

where:
 = Grain Volume
 = Pore Volume
Cone and Kersey (2010) review laboratory methods for determining porosity. Darlak et al. (2010) discuss the methodological aspects of porosity and pore space measurement in shale rocks. Kazimierz et al. (2004) evaluate the rock porosity measurement accuracy with a helium porosimeter.
Permeability to Air Determination
Dry gas has been used in the laboratory permeability determinations, primarily because it minimizes the fluid-rock reactions. It is also easy to use. In the laboratory, gas is caused to flow through a clean and dry sample of measured length and diameter. The pressure differential and flow rates are measured and the air permeability is calculated from the Darcy equation (Figure 4).
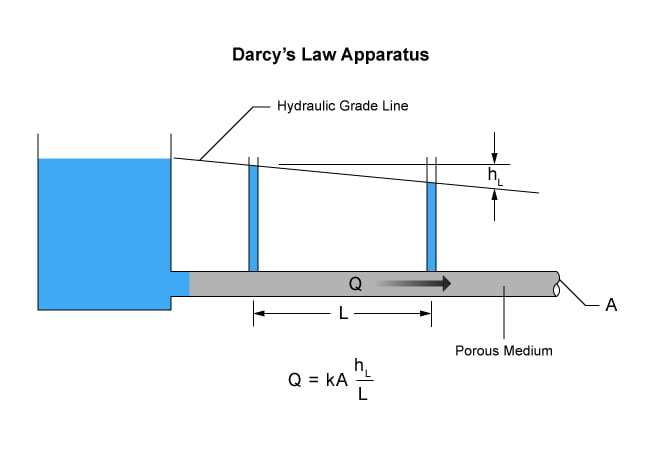
In the linear flow system, the Darcy equation is used to calculate the permeability to a compressible gas, and the rate of flow of the gas is expressed as the mean pressure existing within the core sample. The permeability to air measurements were made after the pore volume determination by the steady state method with pressure release.

where:
 = Permeability to air
 = Viscosity of the gas
 = Differential pressure
 = Mean pressure
 = Atmospheric pressure
 = Flow rate
 = Length
 = Bulk volume
Bustin et al. (2010) review the measurement of gas permeability in tight rocks and unconventional reservoirs. Kieschnick et al. (2010) review the core technology for evaluating the Bakken unconventional reservoir.
Grain Density Determination
The grain density of a rock is defined as the weight of the rock (exclusive of the weight of the fluids contained within the pore space) divided by the volume of the solid rock material (exclusive of the pore space). The grain density varies primarily with the mineral composition of the rock and the state of hydration of the minerals. Grain volume determinations were performed using an extended range helium porosimeter (Figure 5) according to Boyle’s Law. Metal jacket and end-screen weight and volume corrections were applied to the jacketed samples.
The grain density was calculated using the following equation:

where:
 = Grain Density
= Grain Volume
 = Humid Grain Mass
Some of the core samples contain large quantities of hydratable clays. All of the core samples were dried in a humidity oven, ensuring that two molecular layers of water are maintained on the clay surfaces.
Fluid Saturation Determination
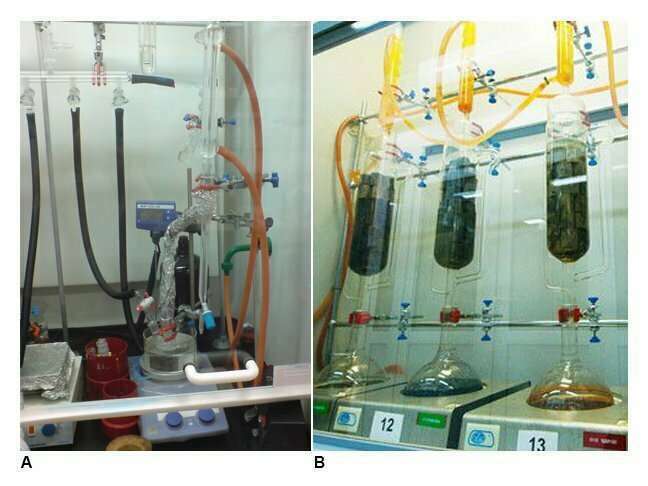
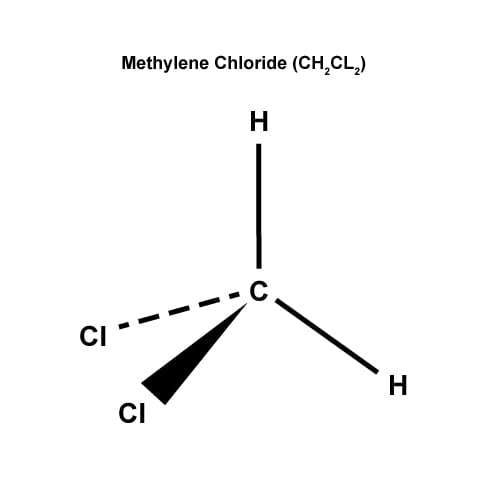
Fluid saturation measurements have the objective of determining the fluids (Dandeker, 2013) within the reservoir prior to its penetration by the well. Consequently, the core report should summarize the core acquisition process, particularly in terms of what fluids may have been introduced to the cored interval during the coring process. Bloys and Warner (2011) review low invasion coring, which minimizes filtrate displacement of any fluids while acquiring cores. Oil and water were extracted from the cores by the Dean-Stark method, using toluene as the solvent. Samples were removed from the Dean-Stark apparatus (Figure 6 A) after the water readings had stabilized. Following Dean-Stark extraction, the core samples were placed into Soxhlet extractors (Figure 6 B) where complete hydrocarbon extraction was performed with methylene chloride (Figure 7). The cleaned samples were then dried in a humidity-controlled oven at 60º C and 45% relative humidity until stable weights were attained. Prior to the analysis, the samples were cooled to laboratory temperature in sealed zip-lock plastic bags. After the grain volume, pore volume and permeability measurements, the core samples were placed into a convection oven and dried at 240º F until stable weights were attained to verify that the core samples had been properly dried.
Oil and water saturations were calculated by Dean-Stark methods by using the following equations:


Where:
 = Oil saturation, percent
 = Water saturation, percent
 = Natural weight
 = Extracted and humidity dried weight
 = Extracted and convection oven dried weight
 = Extracted water with density assumed at 1.0 gm/cc
 = Corrected water
 = Density of oil
= Humid pore volume
Ringen et al. (2002) analyze case studies of, and make recommendations for, measuring reservoir water saturation in cores.
Core Photography
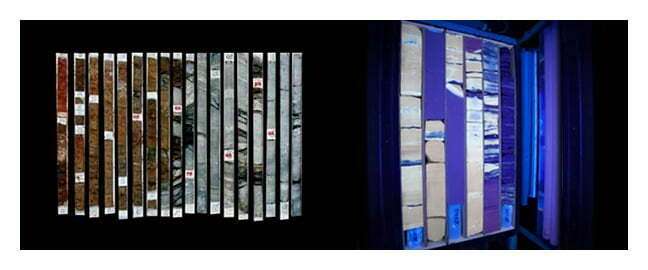
The full diameter cores were slabbed with a slabbing division of one third and two thirds. The one third sections were cleaned to remove the coring fluid and then color photographs were taken (Figure 8).
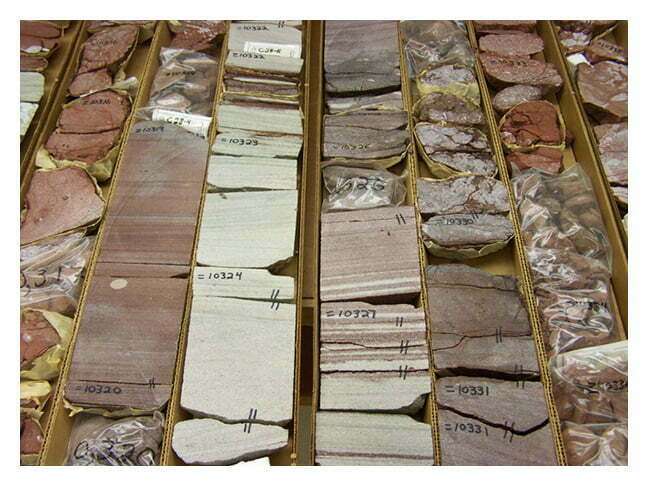
Photographs of the core, composited so that a long section of core was visible in the same frame, were taken under natural and ultraviolet lighting conditions (Figure 9). Fluorescence under ultraviolet light indicates the presence of hydrocarbons. The results of the photography were then mounted.
Core Sample Disposition Location*
The plastic sleeve core is stored chilled at the warehouse in Balikpapan, Indonesia pending decisions on, and instructions for, additional analyses before permanent storage. Some types of rock are extremely durable, but even apparently durable rocks undergo various subtle changes when exposed to the elements, and other rocks deteriorate rapidly.
* It is well worth ensuring the best possible conditions for long-term core storage.
Plug Analysis
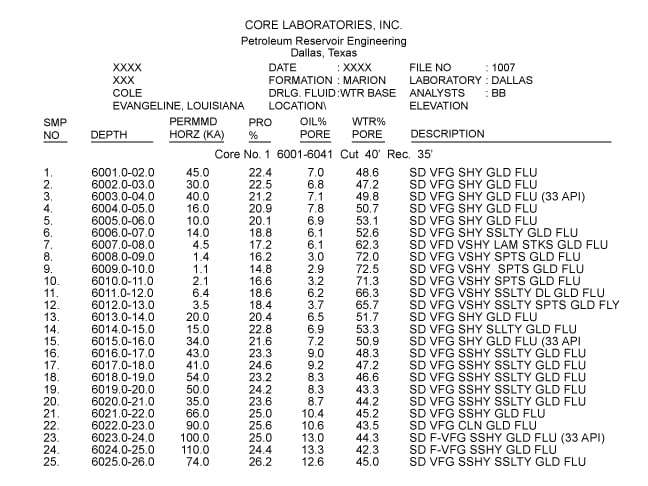
Figure 10 displays the conventional core analysis results, showing the permeability, porosity, fluid saturation and fluorescence from core plugs at specified depths from a well in the Gulf of Mexico. Both saturations and fluorescence indicate that the zone is oil saturated from top to bottom.
A plotted core graph for the same well is illustrated in Figure 11.
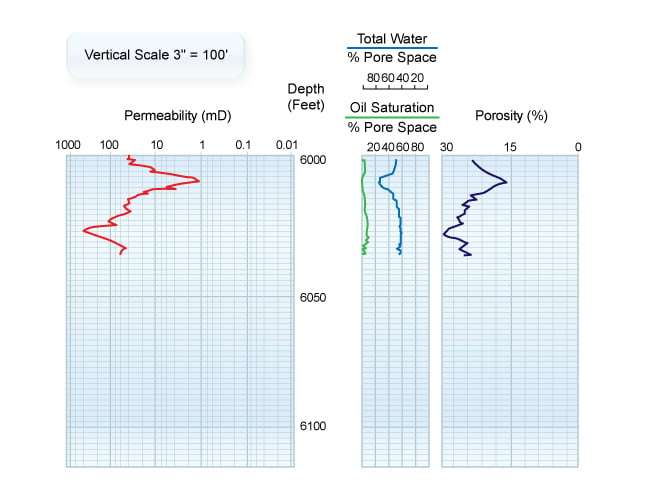
The low permeability zone from 6007 to 6013 ft shows low porosity with higher water, and low oil, saturations. This is not an oil-water transition zone, but is the result of a decrease in rock quality accompanied by a decrease in hydrocarbon saturation in the reservoir, and thus in the core.
Figure 12 displays porosity and permeability histograms for the same core.
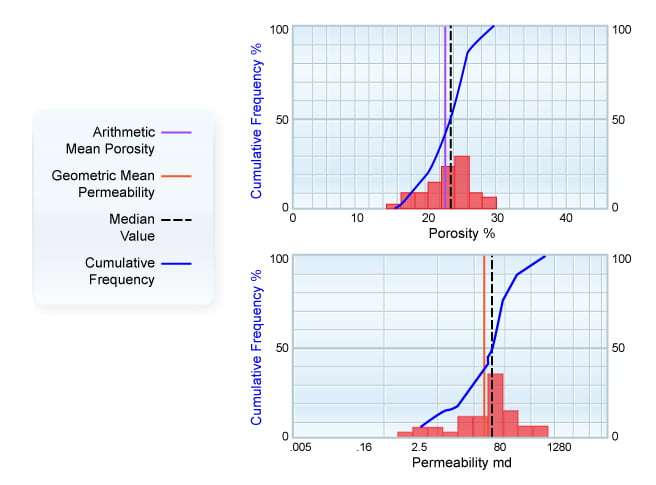
These histograms provide visual documentation of frequency (percentage of total samples) distribution patterns and median values, as well as arithmetic average porosity and geometric average permeability values. The storage capacity (in porosity-feet) and flow capacity (in millidarcy-feet) are presented as cumulative curves. If you enter the porosity histogram with a porosity cut-off, for example, at 20%, you will find that 20% of the 35 ft recovered has a porosity of 20% or less. Therefore, disregarding samples of 20% porosity or less will result in a loss of 15% of the total storage capacity of the reservoir. Similar information is available from the permeability histogram.
Figure 13 shows permeability versus porosity data for the same well.
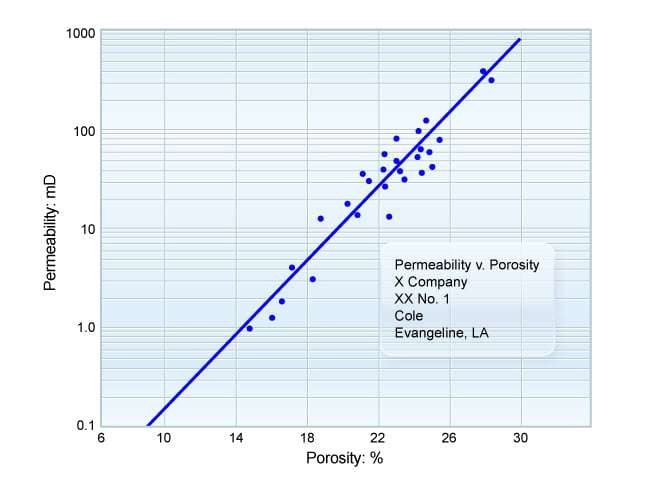
The normal general trend is evident—increasing permeability is accompanied by increasing porosity. This curve can be compared to curves from adjacent wells to see if such relationships are essentially the same or vary across the field. If similar porosity versus permeability trends are observed, special core analysis data generated in one well can be confidently applied to others. This plot, in conjunction with the histograms, serves as a basis for the selection of a suite of cores to be subsequently tested by special core analysis. Certain rock properties trend as a function of permeability, while others trend with porosity; therefore, it is essential that the test suite cover observed ranges of both permeability and porosity. Crain (2014) reviewed some alternative data presentation formats.
Sattler (1989) presented a comprehensive core analysis report on low permeability sandstone reservoirs. Sonnenberg (2012) summarized the analysis and results which need to be emphasized in core analysis reports of unconventional reservoirs.
Full Diameter Core Analysis
Figure 14 presents the tabular core analysis data from a full diameter core analysis of a heterogeneous dolomitic carbonate formation. Two horizontal permeability measurements (at maximum and 90 degree orientations), together with the vertical permeability and grain density, were run and are reported. Full diameter core samples, especially dolomitic carbonates, sometimes contain vugs and fractures that are excluded from core analysis plugs and, therefore, often have higher measured permeabilities. To counteract this, the core permeability has been measured in two horizontal directions for this well. One measurement (reported as “Perm Max”) is made parallel to the major fracture planes and reflects the influence of the fractures as fluid flow pathways. The second measurement is made perpendicular to the first. This value, reported as “Perm 90º,” reflects the matrix permeability and is close to conventional core analysis permeability.
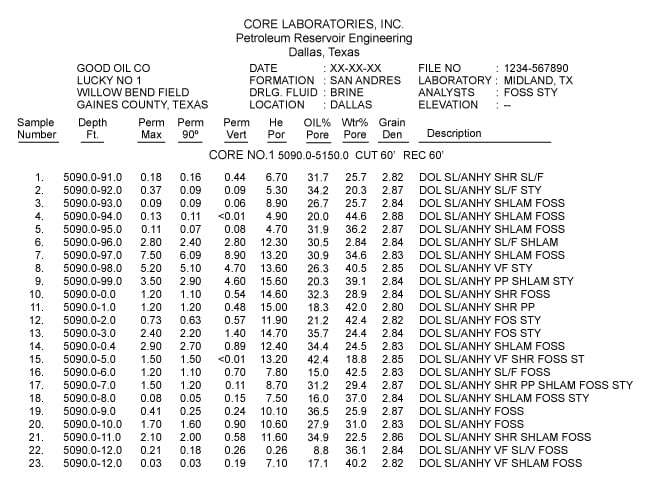
Natural fractures are important characteristics of many reservoirs, both conventional and unconventional (Nelson, 2002). Fractures are vital for predicting the reservoir properties and fluid flow potential, as well as determining the paleo-stress directions and the mechanical and velocity anisotropy. It is important that the core analysis report comprehensively document the natural fractures within the core, taking care to eliminate those fractures which were induced by the core acquisition processes. Many unconventional reservoirs require fracking to enable commercial production. Examine the fractures’ characterization and their effects on production and oil recovery in unconventional reservoirs.
Figure 15 shows the core analysis data graphically for the total interval analyzed.
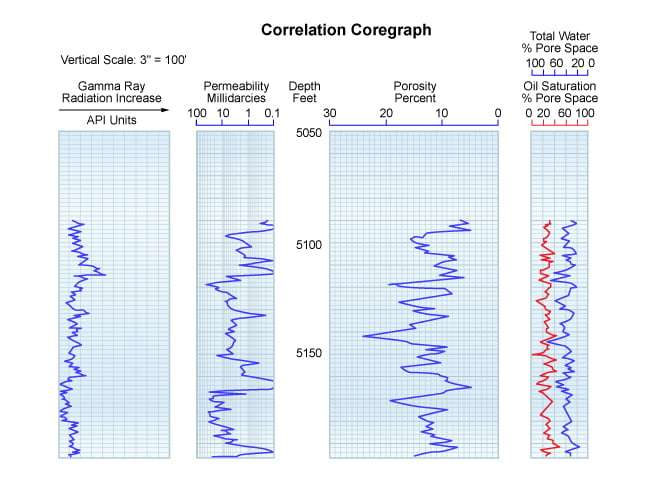
A gamma ray analysis (core gamma ray) was also run and is included in the results. The gamma ray results can be easily compared to the porosity, permeability and residual saturations, and are available for comparison with a downhole log of the well for core versus log depth correlation.
The total interval shown is oil saturated. The presence of low permeability horizontal barriers is clearly seen, and the higher permeability and porosity zones to be perforated are easily identified. In thick carbonate reservoirs, failure to recognize the presence of low permeability lateral barriers can result in oil being left unrecovered behind casing. The zones separated by the low permeability barriers will waterflood at different rates, depending upon the magnitude of permeability. This zonation must be accounted for in reservoir engineering studies and simulation models.
Sidewall Core Analysis
The irregular intervals of sidewall core samples reduce the usefulness of a graphical presentation of the sidewall data. Because of this, tabular information, as shown in Figure 16, is all that is normally presented in core analysis reports. Data from multiple zones are often seen in a single report.
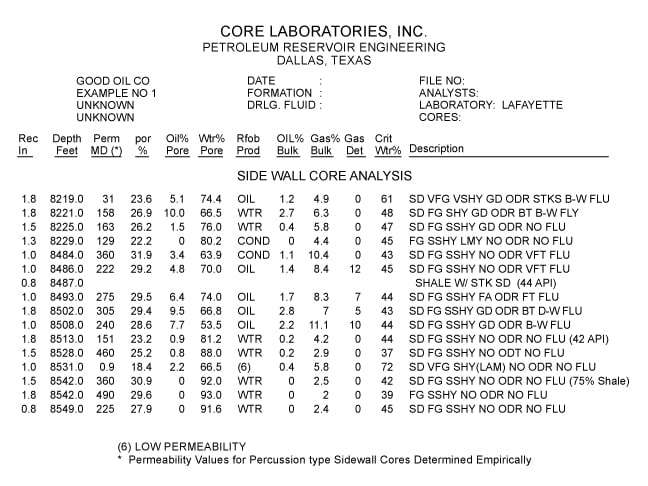
Four separate zones of good porosity and permeability are illustrated in Figure 16. The upper zone is interpreted to be oil productive, but to include an oil-water contact between 8221 ft and 8225 ft. This contact is indicated by the loss of residual oil and increase in total water saturation below 8221 ft. No hydrocarbon odor and no fluorescence were observed in the zone interpreted to produce water.
The zone between 8484 ft and 8513 ft is interpreted to be gas condensate productive in the upper portion. This overlies an oil column, with an oil-water contact below 8508 ft.
The lower two zones are both interpreted to be water bearing. This interpretation is based on the existence of low to zero oil saturation, high total water content, and no hydrocarbon odor or fluorescence.
Several pieces of data unique to sidewall analysis are shown.
- The column “Rec In” refers to the length in inches of the sidewall sample recovered.
- “Oil % Bulk” and “Gas % Bulk” equal, respectively, the cubic centimeters of corrected oil and gas volumes in the analyzed sample, divided by the bulk volume of the sample. This fraction has been multiplied by 100 to yield the percent data shown.
- “Gas Det” is the result of a measurement to detect hydrocarbon vapors in the sidewall glass container. A reading greater than zero is a positive indicator of hydrocarbons. If at zero, it means only that vapors were not present at the time of testing. They may have escaped from the bottle; therefore a zero reading is not necessarily a negative indicator.
- “Crit Wtr %” defines the maximum water saturation a sample with the measured permeability and porosity can retain, and yet not produce water. This value is determined independently, using special core analysis data, and then correlated with basic core analysis permeability and porosity information. In subsequent wells, knowledge of permeability and porosity allows estimation of the critical water saturation.
The critical water value should be compared to the reservoir in-place water saturation that has been calculated from downhole LWD and wireline well logs. If the in-place water saturation does not exceed the critical value, the well will produce only hydrocarbons. These data are particularly important in low permeability reservoirs whose critical water saturation can be as much as 60% and occasionally greater, yet will still produce only hydrocarbons with no water. Without a knowledge of the permeability and porosity from core data and the estimate of high critical water saturation, a well that has been evaluated on the basis of well logs alone may not be tested further or may be abandoned on the basis of its high level of log-calculated water. This water, although present, is held in place by capillary forces and will not flow.
