Related Articles


Irreducible Water Saturation
At the molecular level, the interaction between clay and water results in lower resistivity values. At the microscopic level, water, rather than clay, is a prime factor contributing to low resistivity pays.
The irreducible water saturation, sometimes called the critical water saturation, is the maximum water saturation that a formation with a given permeability and porosity can retain without producing water. This water, although present in the formation, is held in place by capillary forces and will not flow.
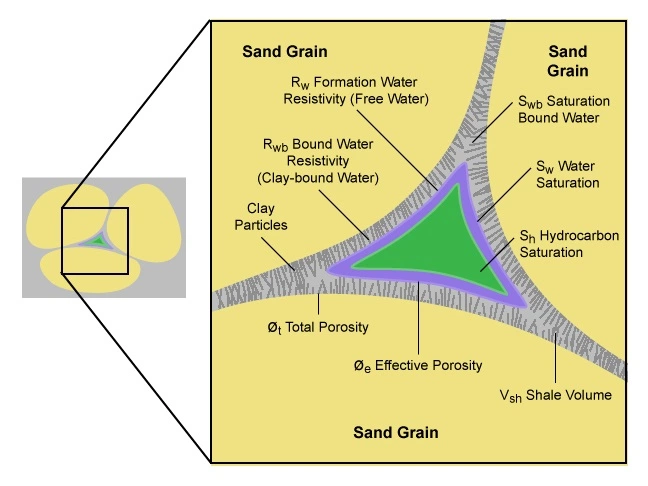
Although not producible, the irreducible, or bound, water (Figure 1) is detected and measured by resistivity logging tools, which are not able to distinguish between freely producible water and immovable water.
The factors that influence the irreducible water saturation within a formation include interactions between the fluids and the rocks, as well as interactions between different fluids. By examining the porosity, relative permeability, and capillary pressure relationships, along with the rock texture and structural elevation, it is possible to determine if a well that has high water saturation calculations will either produce water along with hydrocarbons or produce the hydrocarbons water-free.
Porosity
Porosity is the ratio of pore space in the rock to the bulk volume of the rock. It is expressed as a fraction, or as a percentage, of the bulk volume. In equation form, the porosity relationship is:

Where:
ϕ= Porosity in fraction
Vp= Pore volume
Vb= Bulk volume
Vp and Vb can be expressed in any consistent units
Porosity Classification
Pertaining to the effect of the porosity on hydrocarbon production, there are three types of porosity—total porosity, effective porosity, and non-effective porosity.
Total porosity refers to all the pore space within a rock. Effective porosity refers only to that part of the total porosity consisting of interconnected pore spaces. Effective porosity is that portion of the total porosity which will allow fluid flow under normal recovery processes in the reservoir (Figure 2). Non-effective porosity is the remaining portion of the total porosity which occurs either as isolated pores or as microporosity and will not contribute to hydrocarbon production.

The difference between these three types of porosities may be most significant in highly vugular or fractured carbonate reservoirs, where some vugs or fractures may be isolated. The presence of clay also complicates the definition of rock porosity. Although the layer of closely bound surface water on the clay particle can represent a very significant amount of porosity, it is not available as potential reservoir porosity for hydrocarbons. Thus, a shale or shaly formation may exhibit a high total porosity, while actually having a low effective porosity as a potential conventional resource hydrocarbon reservoir. Bound water is held by the non-effective porosity. When the water saturation is calculated from well logs, the effective porosity is the porosity used in most water saturation equations except the Waxman-Smits-Thomas and dual water models.
Microporosity
Microporosity refers to pore spaces that are 4μ or less in diameter, so small that they trap and hold water immobile through capillary action. Microporosity is commonly associated with authigenic clay minerals whose open structure is able to trap water. Another example is chalk, which commonly exhibits a large percentage of microporosity and has very high total porosity in the 30’s percent range, but often has low matrix permeability.
Microporosity is considered non-effective porosity, as far as the hydrocarbon production potential of a conventional resource reservoir is concerned. If it is not recognized as such, microporosity can lead to optimistic predictions of the reservoir porosity. Conversely, the bound water associated with extensive microporosity can lower log resistivity readings and lead to pessimistic estimates of the water saturation.
Fluid Saturation
Fluid saturation is a measure of the relative volume of each fluid in the pores. The oil saturation is defined as the ratio of the volume of the oil in a porous rock to the total pore volume of the same rock. It is expressed either as a fraction or as a percentage ranging from 0% towards, but never reaching, 100%. Water is always present in all reservoirs, so the water saturation is always greater than zero. By contrast, the oil saturation is zero in dry gas reservoirs, and the gas saturation is zero in oil reservoirs when the reservoir pressure is above the bubble point. Oil or gas saturation in two phase reservoirs is calculated by subtracting the water saturation from 100%.
Irreducible Water Saturation
Irreducible water saturation, sometimes called critical water saturation, defines the maximum water saturation that a formation with a given permeability and porosity can hold without producing water alongside the hydrocarbons. This irreducible water, although present, is held in place by capillary forces and will not flow. Critical water saturations are usually determined through special core analysis (SCAL) studies and confirmed by well testing.
The irreducible water saturation value should be compared to the reservoir’s in-place water saturation, which is calculated from logging while drilling (LWD) and wireline logs. If the in-place water saturation does not exceed the critical value, then the well will produce only hydrocarbons with no water. These water saturation comparisons are particularly important in low permeability reservoirs with a high shale volume, where the critical water saturation can occasionally reach as high as 60% while still producing only hydrocarbons.
Using Nuclear Magnetic Resonance to Determine the Bound Water Saturations
After describing the total, effective, and non-effective porosity, the saturation of the non-producible, bound water or irreducible water can be defined in terms of the effective and total porosity through the following equation:

Where:
Swb= is bound water saturation
ϕT= is total porosity
ϕE= is effective porosity
This bound water saturation equation divides the non-effective porosity by the total porosity.
Total and effective porosity measurements can be obtained through nuclear magnetic resonance logging.
Ostroff, Shorey and Georgi (1999) use a variation on the Hill, Shirley, and Klein formula (1979) to show how nuclear magnetic resonance log measurements can relate the bound water saturation to the cation exchange capacity and the in-situ flushed zone water salinity:

Where:
Qv= The cation exchange capacity per unit volume
Co= The salinity of equilibrated saturant brine in equivalentsliter
Swb= The NMR-derived clay bound water saturation, which equals CBW/ϕtotal where CBW is NMR-derived clay bound water
Wettability and Interfacial Tension
The fluids that can be found in a petroleum reservoir are water, oil, and gas. When they exist as free phases, they are often immiscible. When immiscible fluids co-exist within the pore spaces of a reservoir, their interactions with one another and with the enclosing rock will control their spatial distribution and movement. The two principal properties used to quantify these interactions are wettability which relates to rock-fluid interactions, and interfacial tension which relates to fluid-fluid interactions.
Wettability
Wettability (Figure 3) is the tendency for a fluid to preferentially spread on, or adhere to, a rock surface in the presence of other immiscible fluids.

In any hydrocarbon reservoir, we are concerned with water-oil-solid, gas-oil-solid, or gas-water-solid systems. In systems involving the two liquid phases of oil and water, one of the liquid phases will preferentially wet the rocks’ surface, and hence is termed the wetting phase, whereas the other is termed the non-wetting phase (Figure 4). In systems involving gas, the liquid is always the wetting phase, whereas the gas is non-wetting.

Interfacial Tension
The wettability of a surface is determined by the interaction of the interfacial energies that act on the fluids and the surface. For two immiscible fluids existing together in a porous media, the one with the lower interfacial tension is the wetting phase, while the other is the non-wetting phase. Interfacial tension is a measure of the surface energy per unit area of the interface between two immiscible fluids, such as water and oil or oil and gas. The lower the solid-fluid interfacial tension, then the lower the surface energy and the higher the tendency for the fluid to wet that surface (Figure 5).

Permeability
Permeability is a measure of the ability of porous rock to transmit fluid. Permeability is classified as being either absolute or effective, depending on whether one or more fluids occupy the pore spaces of the rock.
Absolute, or base, permeability occurs when only one fluid is present in the rock. It is independent of the fluid used in the measurement. The assumption is that the fluid does not interact with the rock.
Effective permeability is the measured permeability of a porous medium to one fluid, when other fluids are present. Effective permeability depends on the relative proportion of the fluids present—their fluid saturation.
Consider the case of oil and water together in a pore system. Under a given pressure gradient, the oil and water flow through a pore system together. Based on Darcy’s equation, the effective permeabilities are:
For oil:

For water:

Where:
k= Permeability to the fluid
q= Flow rate of the fluid
μ= Fluid viscosity of the fluid
Δp= Pressure differential
L= Length
A= Cross-sectional area
The total flow rate, Qt, is established by the equation:

Qt is less than the flow rate that both phases would have added together if each were to be at 100% saturation. This is a result of the two phases interfering with, and hampering, each other’s progress through the pore system. This phenomenon gives rise to the term relative permeability (kr).
Relative Permeability
Darcy’s definition of permeability was based on a porous medium which was 100% saturated with the water flowing in single phase. Routine laboratory permeability measurements are normally made with a single fluid filling the pore space. However, this is seldom the case in the reservoir situation, except in water zones. Hydrocarbon reservoirs have two, and sometimes three, phases present that share the rock’s pore spaces: water and oil, water and gas, and water, oil, and gas.
Having more than one phase present in the pores reduces the ability of the rock to transmit any one of the fluid phases. Consequently, the effective permeability is defined as the permeability to one phase when there is more than one phase present in the pore space. Its value decreases as the phase’s saturation decreases. There is an effective permeability value for each phase present.
The effective permeability is usually expressed as a fraction of the absolute permeability, which is the permeability at 100% saturation of the flowing fluid. This ratio of the effective to the absolute permeability is termed the relative permeability, and can be displayed as a set of curves for an oil and water system (Figure 6).
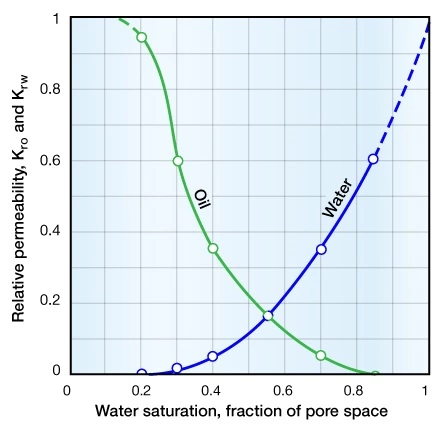
Figure 6 shows that the relative permeability to oil decreases as the oil saturation decreases and the water saturation increases above its irreducible level. Conversely, the relative permeability to water increases, reaching a maximum when the oil saturation is at its residual saturation. The residual oil saturation (Srow) is the final value of the oil saturation from laboratory waterflood displacement experiments. The residual oil saturation is achieved after an infinite number of pore volumes of the displacing fluid have flowed through a reservoir rock sample. Residual oil saturation is the ratio of the immobile residual oil volume divided by the effective porosity.
This same general principle applies to any two- or three-phase system. The figure shows that relative permeability is also a function of the fluid saturation. When multiple immiscible fluid phases flow in a rock, the sum of the effective permeabilities of the various fluids is commonly significantly less than the absolute permeability measured with only a single fluid in the rock.
Relative permeability is the ratio of the effective permeability of the rock to one phase divided by the absolute permeability, and it is quoted at some particular saturation value:


Where:
kro= the relative permeability to oil
kr= the effective oil permeability
k= the absolute permeability
krw= the relative permeability to water
kw= the effective water permeability
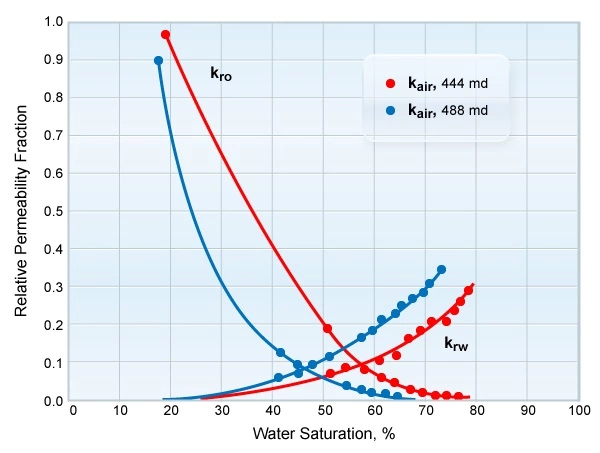
Figure 7 displays the relative permeability data for two different facies.
Relative Permeability and Irreducible Water Saturation
Another important relative permeability concept is that of the irreducible water saturation.
When two fluid phases, A and B, are flowing in a rock, the relative permeability of fluid phase A will decrease as the saturation of fluid A decreases. At some non-zero saturation of fluid A, it will cease to flow, and only fluid B will continue to flow in the rock. The saturation at that point is termed the irreducible saturation of fluid A for the A-B two phase flow system in this rock.
Relative permeability to oil at the irreducible water saturation is 100%, or 1. As the water saturation increases, kro decreases until it effectively reaches zero at some high water saturation corresponding to Sor, the residual oil saturation.
Relative permeability to water commences at zero when the rock is at irreducible water saturation, Swi, and thereafter increases as the water saturation, Sw, increases. In an oil-wet system, kro is always less at a given Sw than in a water wet system. Conversely, krw is always greater in an oil-wet system than in a water-wet one.
Many researchers in this field have proposed generalized empirical equations to relate kro and krw to Sw, Swi, and Sor. Of particular note are those cited in Honarpour, Koederitz and Harvey (1982), Molina (1983) and Pirson, Boatman and Nettle (1964). A commonly used approximation gives:


If a well is completed at a structural elevation above the top of the transition zone where the reservoir is at irreducible water saturation (krw=0), then water will not be produced along with the hydrocarbons.
Capillary Pressure
Water levels in two connected containers have the same level if exposed to the same atmospheric conditions. However, there is a different, and more complex, situation at the capillary scale of an oilfield reservoir. Consider what happens when a capillary tube is dipped in a larger container filled with water (Figure 8). The water in the capillary tube rises above the water level in the container to a height that depends on the capillary’s size. The water still finds its level, but it does so in such a way as to maintain an overall minimum surface energy. The adhesion force allows water to rise up in the capillary tube while gravity acts in the opposite direction. The water rises until there is a balance between these two opposing forces. The differential force between adhesion and gravity is the capillary force. This force per unit area is the capillary pressure.

Capillary pressure is defined as the pressure difference between two fluid phases, such as oil and water, at the same point in the reservoir. It is a measure of the rock-fluid adhesion and fluid-fluid interfacial tension forces that act to hold the water fluid phase at an elevation in the reservoir above the oil water contact against the force of gravity. Capillary pressure is a complex function of the nature of the contained fluids, the saturation of the fluid phases, the wettability of the rock and the pore size distribution of the rock.
The relationship between capillary pressure, Pc, and the interfacial tension between the two fluids is:

Where:
 = Capillary pressure
 = wetting/non-wetting phase interfacial tension
 = radius of the tube
 = angle of contact between the solid surface and liquid
Capillary Fluid Rise
An alternative approach to expressing the capillary pressure is in terms of height above a free water surface, termed the free water level, where the capillary pressure is zero. The capillary pressure is equal to the product of the height above the free water surface and the density difference between the two fluid phases at reservoir conditions. In a reservoir, the relationship between the water saturation and the height above an oil-water or gas-water contact is very much a function of the rock pore system, as well as the wettability and interfacial tension properties of the rock-fluid system.
In Figure 8, the capillary tube of radius r will support a column of water of height, h. If the density of the air is ρa and the density of the water is ρw, then the pressure differential at the air-water contact is simply (ρw−ρa)⋅h. This pressure differential acting across the cross-sectional area of the capillary is exactly counterbalanced by the surface tension, T, of the water film acting around the inner circumference of the capillary tube. If the contact angle is θ at the interface between the water and the glass face of the capillary tube, then at equilibrium we have:

Force= Pressure ⋅ Area
By simplifying and rearranging this expression, the height is expressed as:

As the capillary tube radius (r) decreases, the height (h) of the water column increases. The height of fluid rise above a free water surface in a capillary tube is inversely proportional to the radius of the tube.
Translating this laboratory observation in terms of reservoir conditions where there is an oil-water fluid system and the pore throats replace the tube, the water can be drawn up into what would otherwise be a 100% oil column by the capillary effect resulting from small pores in the rock system. The maximum height, h, to which water can be raised is controlled by the following factors:
- The surface tension, T, between the oil and water phases
- The contact angle, θ, between the wetting fluid, water, and the rock
- The radius of the pore throats, r
- The density difference between phases, ρw−ρo
In summary, the capillary rise will be greater in a rock with smaller pore throats than in one with large pore throats.
Length of the Transition Zone
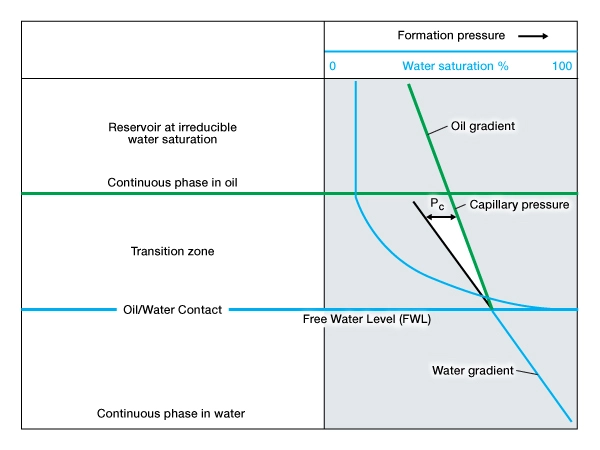
Reservoirs with large pore throats and high permeability have relatively short transition zones, and vice versa (Figure 9). The term transition zone refers to the lower part of a hydrocarbon column above the free water level (FWL) that contains water saturations higher than the irreducible water saturation. The free water level is the zero capillary pressure point, the highest elevation at which the pressure of the hydrocarbon phase is the same as that of water.
The transition zone at a gas-oil contact will be shorter than that at an oil-water contact because of the inter-phase density differences.
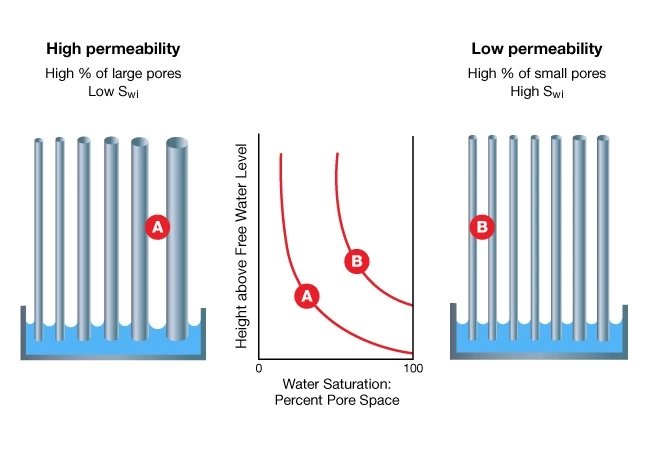
Because a formation’s pore system is made up of a variety of pore sizes and shapes, no single pore throat radius can be assigned to a reservoir as a whole. Depending on the size and distribution of the pore throats, certain available pore channels will raise water above the free water level. The water saturation above the top of the transition zone will, therefore, be a function of the reservoir’s porosity, permeability, and pore size distribution.
In a water-wet system, the water will wet the surface of each grain. At the time that oil migrates into and begins to fill a conventional resource reservoir, the capillary pressure effects will be such that the downward progress of oil as it fills the reservoir is most strongly resisted in the smallest capillaries. Large diameter pores offer little resistance, as the capillary pressure is low because the pore radius is large. Small diameter pores offer greater resistance because the capillary pressure is high because the pore radius is small. For any given reservoir, the densities of the oil and water, ρo and ρw, determine the pressure differential that an oil-water meniscus can support.
Capillary Pressure and Irreducible Water Saturation
The maximum oil saturation is controlled by the relative number of small and large capillaries, or pore throats. The maximum possible oil saturation is the minimum possible water saturation, referred to as the irreducible water saturation, Swi.
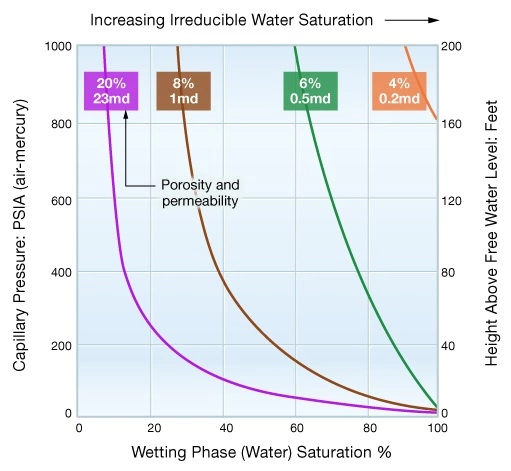
Shaly, silty, low permeability formations with their small pore throats and high capillary pressures tend to have high irreducible water saturations. By contrast, coarse grained, clean sandstones of high permeability tend to have low irreducible water saturations. Figure 10 illustrates this concept by comparing the capillary pressure curves for four formation types with differing porosities and permeabilities.
Structural Elevation within the Reservoir
Gravity segregation over geological time causes a natural stratification of the reservoir fluids, with gas on top of oil, and oil above water. In the absence of any rock pores, the gas, oil, and water would form distinct layers, with sharp contacts between each phase. In a real reservoir situation, however, the contacts between each phase are less distinct.
Figure 11 is a pressure versus vertical depth plot which divides the reservoir into three levels. The upper level is mainly oil; the lower level is all water, while the middle level shows ever increasing concentrations of water as the depth increases. Plotted on the right-hand panel is a curve of water saturation versus the vertical depth, together with a plot of the fluid pressure in the pore spaces.
Whenever a formation is at irreducible water saturation above the top of the transition zone, the product of ϕ and Sw is a constant. Variations of porosity are normal on a local scale, caused both by variations in the depositional environment and by subsequent diagenesis. If the porosity is reduced locally, then either a greater proportion of pore throats will be small or there will simply be fewer pore throats. In either case, the mean radius of the pore throat, r, will be smaller. Consequently, Pc will be larger and more water can be held in the pore maintaining the constant:

After the logs in a well have been petrophysically analyzed to generate estimates for the porosity and the water saturation, a plot of ϕ versus Sw establishes the top of the transition zone.
Figure 12 is a crossplot of porosity versus water saturation on a log-log scale, where the points at irreducible saturation plot along the red straight line, and the points in the transition zone plot to the top right of this irreducible line.
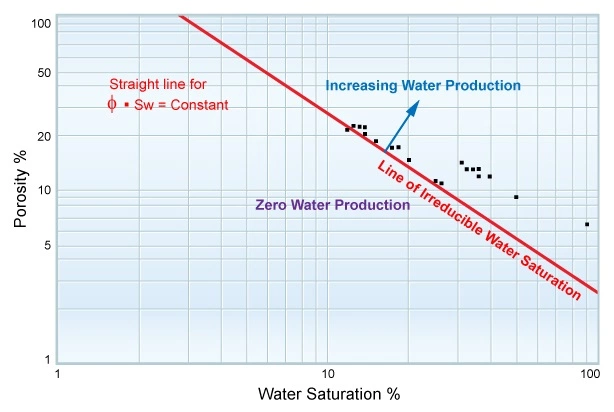
By plotting the product of ϕ⋅Swi, it is possible to predict certain production characteristics for when an interval in a well is completed and hydrocarbon production commences. For points above the irreducible water saturation, some water production is to be expected, depending on the mobility ratio,  , for the particular fluids present. In low porosity, low permeability formations, high water saturations can be tolerated without fear of water production together with the hydrocarbons. Conversely, in other formations that exhibit very good porosity and permeability, even moderate values of Sw often mean that some water production should be expected.
Because both capillary pressure and relative permeability data are a strong function of the pore size distribution and geometry, they will often fall into groups that correlate with specific reservoir facies. Two different reservoir facies may show very different relative permeability relationships, even though their other reservoir properties, such as porosity or permeability, may be very similar. Figure 13 shows water-oil relative permeability curves for two samples with almost identical permeabilities, taken from two different geological facies. The difference in the measured relative permeabilities illustrates the importance of the particular pore system configuration in determining the fluid flow characteristics.
The evaluation of capillary pressure and relative permeability data for specific geological facies can help to determine the oil-water and gas-water contact elevation. The oil-water contact elevation can occasionally be different from the free water level. However, the free water level will be at a constant elevation throughout the reservoir, providing the reservoir is in a state of gravity-capillary equilibrium with no significant flow occurring. The producing oil-water contact is often taken as the highest elevation where 100% water is produced. This depth will not necessarily be at exactly the same at all points in the reservoir, even under equilibrium conditions. It will depend on local capillary pressure and the relative permeability characteristics of the rock.
Capillary Pressure and Geological Facies
A relationship between geological facies and capillary pressure curves is illustrated in Figure 14. Three geological facies, A, B and C, are shown, each having a different capillary pressure versus water saturation relationship. On the right side of the figure, increasing capillary pressure has been expressed in terms of height above an oil-water contact. Each of the curves becomes asymptotic to the irreducible water saturation, in spite of large increases in capillary pressure, or height above the oil-water contact.

The three different geological facies in this figure also have contrasting permeabilities, although their porosities are similar. Capillary pressure versus water saturation data often correlates very strongly with permeability because both properties are strongly dependent on pore throat size distribution.
At a measured capillary pressure of 10 psi, equivalent to a height of 25 ft (7.6 m) above the oil-water contact, the water saturation in Facies A has been reduced to the irreducible water saturation of less than 10%. At the same height above the oil-water contact, the water saturation in Facies B is approximately 40%, above the irreducible water saturation of 30% for Facies B. At points in the reservoir where the shaly limestone Facies C is present at the same height above the oil-water contact, the water saturation could be over 95%. The capillary pressure versus water saturation curve for Facies C indicates that this facies would likely not be considered as pay in this reservoir.
Summary
The irreducible water saturation within a formation is influenced by interactions between fluids and rock, as well as interactions between different fluids. By examining porosity, relative permeability, and capillary pressure relationships, along with the rock texture and structural elevation, it is possible to determine whether a well having high Sw calculations will produce water along with hydrocarbons or produce the hydrocarbons water-free.
Moving towards the top of a fining upward depositional sequence, the decrease in the sand grain diameter will produce a corresponding decrease in the pore throat radius. This decrease in the pore throat radius is accompanied by an increase in the capillary pressure, increasing the amount of water that can be imbibed into the system. If clay or silt is added, the microporosity will constitute a substantial percentage of total porosity. Such a setting will produce high values of irreducible water saturations.
Both irreducible water and residual hydrocarbon saturations are strongly influenced by the rock texture, which is controlled largely by the depositional environment. Fine-grained sediments, often characteristic of low energy depositional environments, tend to have high irreducible water saturations with high residual hydrocarbon saturations. Coarse-grained sediments, characteristic of high energy depositional environments, tend to have low irreducible water saturation and low residual hydrocarbon saturation. Fine-grained sediments tend to have lower permeability than coarse grained sediments, all other factors being the same.
The formation’s porosity, capillarity, relative permeability, structural elevation, and grain size will all influence the irreducible water saturation in a low resistivity pay zone.
