Related Articles


Geosteering in Fractured Carbonates
The well in this example was drilled in Gonzales County, Texas to test a fractured carbonate reservoir in the Upper Cretaceous Austin Chalk formation. The Big Kahuna #1-H horizontal well was spudded from a surface location about two miles east of a vertical well that had previously produced over 200 MBO. Prior to drilling this #1-H well, an earlier horizontal well had been drilled to the south of the vertical producer, but proved to be noncommercial. This unsuccessful horizontal well had been drilled into the “E” zone of the Chalk in hopes of producing from the same interval that had been perforated in the vertical well.
The Austin Chalk is 250 to 750 feet thick in the area surrounding this well, and is further subdivided stratigraphically:
- The “E” zone makes up the basal Chalk section, and is generally more organically rich than the rest of the Austin Chalk. This organic material makes it less brittle and therefore less likely to fracture.
- The “D” zone is generally a little cleaner than the “E” zone, but has lower oil saturation in the matrix, as evidenced by lower resistivity.
- The “C” Zone is the thickest interval in the chalk, and is generally also the cleanest, with the best matrix oil saturation. The “C” zone can be further subdivided into two units, which are distinguished by their matrix oil saturation.
- The “C-1” zone has the best matrix oil saturation in the chalk, and is generally found within the upper 50 to 70 feet of the “C” zone. This zone is further subdivided into the “a” and “b” units.
- The “C-2” zone is the lower portion of the interval, and is just as clean as the interval above it, but has lower oil saturation in the matrix.
- The “Famous Ash” lies above the “C1” zone and forms a very ductile bed consisting of very fine volcanic ash. This thin zone creates a very good seal to prevent upward oil migration. The ash is squeezed into and closes all but the largest open fractures. However, the ash is also a major drilling hazard. Since the ash is very soft compared to the surrounding chalk, it is nearly impossible for the bit to drill out of the ash once it is trapped in the bed. The rule of thumb is that one must drill through the ash at an angle of at least 5 degrees relative to dip angle to keep from getting trapped.
- The “B” zone can also be productive in some areas, but was not targeted in this well. The base of this zone is bound by the Famous Ash. The top of this zone is defined by the Fat Ash.
- The “A” zone lies above the Fat Ash, and though it produces in some areas, was not targeted in this well.
Matrix oil saturation is very important to the fractured Austin Chalk reservoir because the fractures are slowly charged from the matrix. Once the fractures are charged with oil, it is less likely that the fractures will be mineralized. In this area, chalk that has low oil saturation generally has fewer open fractures because water filled fractures tend to close as a result of mineralization.
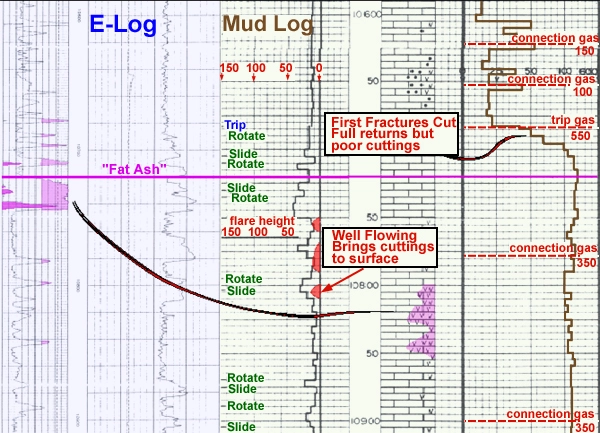
The Big Kahuna #1-H was proposed to test the C1 zone of the Austin Chalk, as shown in Figure 1: (E-log and Mudlog through the target zone).
The well plan targeted the “C1a” portion of the upper C1 zone for the first 2000 feet of reservoir exposure. Seismic data predicted that a 50 -70 foot fault would be encountered once the well had drilled horizontally to a vertical section of ± 2700 feet. The Geosteering Plan called for the borehole to be positioned at the lower “C1b” target before encountering the fault. Once the wellbore penetrated into the down-thrown side of the fault, the GeoSteering Team would determine the TSP of the wellbore across the fault, and then direct the well path to return within the “C1a” target.
The Geosteering Team opted to use the TSPM geo-navigation method, supplemented by evaluation of mudlog samples to steer the horizontal well path. The well was “flow drilled”, keeping the well under-balanced as much as possible. MWD directional and LWD gamma ray tools were used. The KBTVD method was used for reporting target changes in this well.
While drilling the vertical portion of the hole, it was discovered that the well had deviated to the north some 300 feet. This deviation caused the well to reach the casing point 72 feet higher than the original plan. The wellbore plan was therefore adjusted to account for this deviation.
The following account shows how data is interpreted as the well is drilling, and how decisions based on these interpretations affect the course of drilling and ultimately affect the success of the well.
Days 1 & 2
The wellbore cut the first fractures about 100 feet below casing. Full returns continued, though cutting sample quality and quantity subsequently degraded. The LWD gamma ray log detected the top of the “Fat Ash” at 10,720 feet MD. In mudlogger’s samples, the Fat Ash is very easily distinguishable because it has a bright orange mineral florescence.
The well began flowing gas to the surface at 10,750 feet MD, and the Fat Ash was not seen in the samples until 10,800 feet, about 80 feet past the detection on gamma ray. This is a common phenomenon in a fractured reservoir. Wellbore volume is not limited to the borehole itself but often includes open fractures that “breath” in and out, depending upon the pressure gradient across the fracture exposure. In this case, it appears that the ash samples were forced into the formation as the bit crossed the fracture. Then, once a gas bubble started up the well, the fluid in the fracture was swabbed back into the wellbore.
The apparent formation dip in the original plan, based upon seismic interpretation, was expected to be about 1 to 2 degrees in the build section of the well. As the curve was being built, the TSPM interpretation indicated much steeper dips (see Figure 2 and Figure 3).


Note in the Wellbore Plot that the gamma ray log starts 300 feet away from the 0-mark. This is a reflection of the previously described updip drift to the north that the wellbore took before reaching the casing point.
The target information was adjusted at this point to account for these dips. The BUR was just too high to hit this new target, so it was necessary to trip out of the hole to change the BHA for a less aggressive bend in the motor assembly. A new assembly was chosen to finish the curve that could be rotated for later use in the lateral portion as well.