Related Articles


Geohistory, Backstrip Analyses
We use geohistory and backstrip analyses to reconstruct movements and elevations of stratigraphic units and surfaces through time. Geohistory analyses depict the geologic history of stratigraphic units, and we display the elevation and thickness changes of several stratigraphic units on a single diagram. Backstrip analyses determine the causes of tectonic subsidence of a basin — that is, subsidence in excess of that induced by sediment and water loads by matching observed tectonic subsidence curves with subsidence curves from geodynamic models. Consequently, we display only the movements of the surface of the basement or of a stratigraphic surface deep within the stratigraphic column.
Traditionally, geohistory and backstrip analyses include different sets of corrections and display options, but their philosophical bases and calculation processes are essentially the same. Geohistory analyses, developed and illustrated by van Hinte (1978) following earlier work by Lemoine (1911), include corrections for paleowater depth variations and sediment compaction. Backstrip analyses (Steckler and Watts, 1978) include corrections for lithospheric compensation of sediment and water loads, in addition to paleowater depth variations and sediment compaction.
We start with lithologic and age data from a measured stratigraphic column, divided into stratigraphic units whose upper and lower age limits we know or assume. We remove the youngest stratigraphic unit from the column, and then restore subjacent units within this “new” stratigraphic column to their elevations and thicknesses as they existed just before the youngest unit was deposited. We perform restorations by correcting for water depth during deposition, timing and amount of compaction of units, eustatic changes, and lithospheric compensation of the removed stratigraphic unit and water loads Figure 1, Correctinos used in constructing a geohistory or backstrip diagrams.
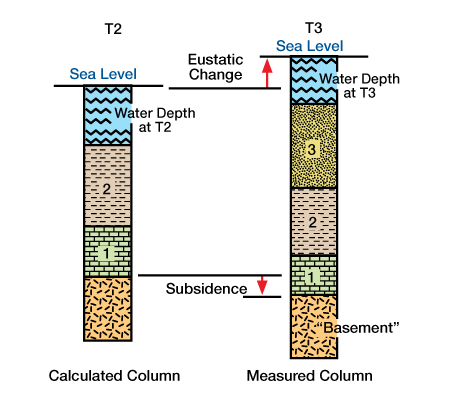
Units 1, 2 and 3 were deposited at times T1, T2 and T3 respectively. Starting with a measured stratigraphic column, the youngest unit, Unit 3, is “removed” and a calculated stratigraphic column for time T2 is determined. Potential causes and results of elevation and thickness changes of units between times T2 and T3 are: water depth at deposition of Units 3 and 2 [2 was deposited in greater water depth than 3]; eustatic change [there was a eustatic rise between T2 and T3]; compaction [Units 1 and 2 are thinner at time T3 due to mechanical compaction]; subsidence [the basement at time T3 is at a lower elevation because of tectonic subsidence, lithospheric compensation of Unit 3 and the eustatic rise.). Continuing progressively with each youngest unit, we remove the top stratigraphic layers and restore the “new” stratigraphic column to its conditions just prior to deposition of the unit just removed. We plot each calculated stratigraphic column on a time-depth graph Figure 2 , Schematic geohistory or backstrip diagrams constructed from stratigraphic columns shown in Figure 1.
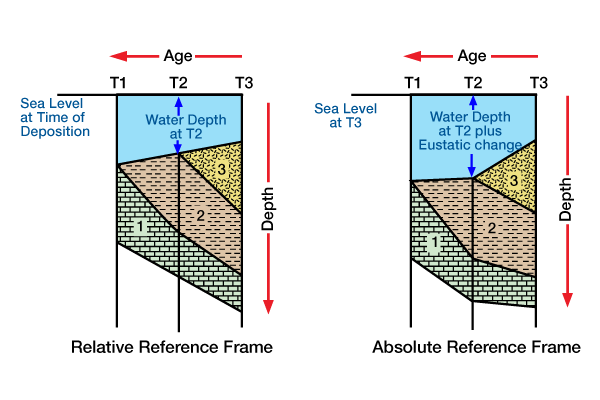
The diagram on the left was constructed without a correction for eustatic changes and has a relative reference frame. For each time [T1, T2 and T3], the depth to the top of the stratigraphic column is equal to the water depth at the time. The diagram on the right was constructed with a correction for eustatic changes and has an absolute reference frame. In this example, the absolute reference frame is sea level at time T3. For each time, the depth to the top of the stratigraphic column is equal to the water depth at that time plus any changes in eustasy relative to eustasy at time T3. Assuming that these diagrams were constructed using corrections for compensation of surface loads, the heavy line at the base of Unit 1 is the tectonic subsidence curve.).
We construct geohistory and backstrip diagrams using different reference frames and dimensions. If we do not apply eustatic corrections, we calculate depths to stratigraphic units relative to the elevation of sea level at each time interval. The diagram has a relative reference frame because eustatic variations cause the absolute elevation of the reference frame to vary for each interval. In this case, the depth to the top of each stratigraphic column is equal to the water depth at that time (Figure 2, left diagram). If we apply eustatic corrections, then we calculate depths to stratigraphic units relative to a chosen absolute reference horizon, such as sea level at a particular past time or at present (Figure 2, right diagram). Commonly, geohistory and backstrip diagrams are one-dimensional, although two- and three-dimensional diagrams are possible. Two- or three-dimensional diagrams may provide greater understanding of the history and shape of basin subsidence, and the elevation and thickness changes of stratigraphic units.
We do not always apply all of the corrections we have discussed. Which corrections we apply and how we calculate them depends on the purpose of our analysis, available data, desired accuracy, and computing capabilities. To use all these corrections in an analysis, we must know or estimate paleowater depths, compaction histories, and eustatic changes. We must also identify all sediment and water loads, and calculate lithospheric compensation to these loads. For example, if a eustatic curve for the time period of interest is poorly known, or if eustatic variations are small relative to total subsidence, then we might not correct for eustatic variations. There may be different approaches to calculating a certain correction, and the approach we use may influence the outcome. For example, if we do not know the basin-wide extent of stratigraphic units, then we may not be able to calculate a flexural compensation of sediment loads, and we might use an Airy compensation model instead.
Constructing Geohistory and Backstrip Diagrams
In this section, we discuss the steps we follow when constructing geohistory and backstrip diagrams. In this example, we backstrip a column of Cretaceous strata from the eastern Powder River Basin, Wyoming (original data courtesy of T.E. Jordan).
Step 1. Select a stratigraphic column:
We start with a measured stratigraphic column that usually has a time span of tens of millions of years. We divide the column into stratigraphic units, assigning absolute ages to the upper and lower boundaries of each unit Figure 3 , Stratigraphic column divided into stratigraphic units for calculating the backstrip and geohistory diagrams used as the example in the text and following figures.
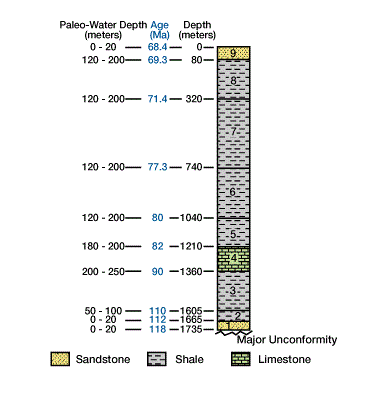
Biostratigraphic ages were calibrated with the absolute time scale to arrive at the age values of stratigraphic units [labeled from 1 to 9] shown. Paleobathymetry estimates are from topographic relief of clinoforms. Stratigraphic column is taken from a portion of a stratigraphic cross section.). The time span and stratigraphic thicknesses we select are a function of the accuracy, density and time/space distribution of the available data. The choice of time span and thickness of the stratigraphic column also depends on the accuracy and appropriateness of compaction and compensation models. The stratigraphic column we use to construct a backstrip or geohistory diagram should: (1) contain a sufficient amount of age-related geologic data so that the resulting curves are detailed and convey geologic reality, and (2) be thick enough so that the total elevation changes of units are large relative to estimated calculation errors.
Properly dividing the column into stratigraphic units is crucial to the accuracy of the final diagram. Creating too few stratigraphic units results in large errors due to over-averaging, while too many units may unnecessarily increase computation time. First, select unit boundaries that represent major time breaks, such as unconformities and hiatuses. Second, select unit boundaries that have good age constraints. Third, to increase ease of computing decompaction and water-depth corrections, subdivide the major chronostratigraphic units into smaller intervals according to lithology. This approach is also useful for estimating thermal conductivities and for calculating temperatures and maturation through time. Sequence boundaries and surfaces associated with major geographic shifts of progradational events are ideal unit boundaries because these surfaces represent breaks in time, separate disparate lithologies, and provide a high-resolution correlation framework for age dating and for estimating paleowater depths using depositional systems or clinoform topography.
Step 2. Plot the accumulation history:
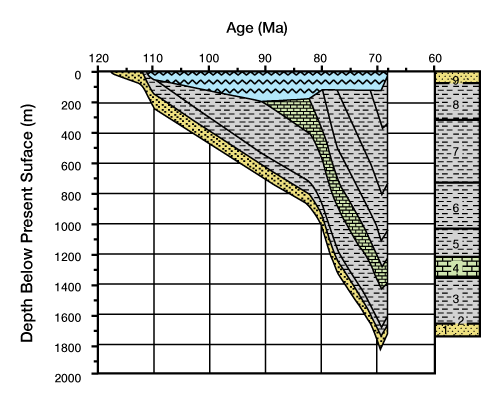
We plot the accumulation history using ages and present thicknesses of the units. In the example shown in Figure 4 (Elevation changes of base of Cretaceous stratigraphic column in Figure 3.
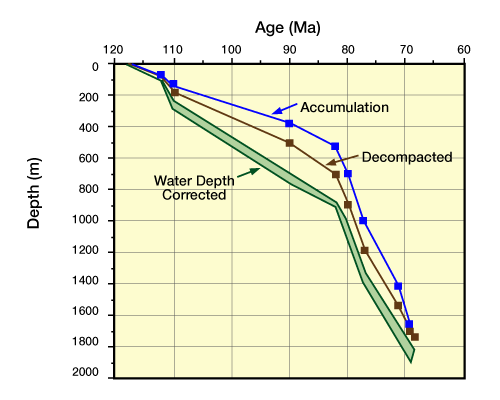
“Accumulation” shows the accumulation history without any corrections. The “Decompacted” curve was calculated from the accumulation history by correcting for progressive and continuous compaction during burial. The lower, hachured curves were calculated by adding minimum [upper curve] and maximum [lower curve] water depth estimates. The accumulation- and decompaction- corrected curves show depth below the sediment-water or sediment-air interface. The water depth-corrected curves show depth below the water-air interface.), the stratigraphic column is 1735 m thick, and we will assume it had the same thickness at 68.4 Mya. Starting with this column, we remove the youngest unit, and calculate a new column thickness by subtracting the thickness of 80 m. Before this unit was deposited at approximately 69.3 Mya, the stratigraphic column was 1655m thick (1735m−80m).
We continue removing stratigraphic units and calculating column thicknesses until we have removed all units. Table 1 shows the depths and thicknesses we calculate for this example. These units form the stratigraphic columns to which we next apply corrections. Because these corrections are applied linearly, we can apply them in any order — it is not necessary to apply the corrections in the order given below.
| Age (MA) | Unit Top | Depth Uncorrected (meters) | Depth Decompacted (meters) |
|---|---|---|---|
| 68.4 | 9 | 1735 | 1735 |
| 69.3 | 8 | 1655 | 1695 |
| 71.4 | 7 | 1415 | 1533 |
| 77.3 | 6 | 1995 | 1187 |
| 80 | 5 | 695 | 888 |
| 82 | 4 | 525 | 701 |
| 90 | 3 | 375 | 508 |
| 110 | 2 | 136 | 179 |
| 112 | 1 | 70 | 88 |
| 118 | Column Base | 0 | 0 |
| Paleo-Water Depth Correction (min/max) | Tectonic Subsidence (Water-Filled) (meters) | Tectonic Subsidence (Air-Filled) (meters) |
|---|---|---|
| 1735/1755 | 860 | 600 |
| 1815/1895 | 975 | 589 |
| 1307/1387 | 760 | 482 |
| 1008/1088 | 614 | 381 |
| 881/901 | 579 | 333 |
| 708/758 | 496 | 267 |
| 229/279 | 156 | 89 |
| 88/108 | 49 | 34 |
| 0/20 | 0 | 0 |
Table 1: Depths of base of the sediment column calculated in the Cretaceous example geohistory and backstrip diagrams. Units are described in Figure 3.
Step 3. Decompact stratigraphic units:
To restore stratigraphic units to their depths and thicknesses at specific times in the past, we must progressively decompact units to their former thicknesses at each time interval. To do this, we must know how much each unit has mechanically compacted, and when.
We commonly assume that any reduction in porosity is due to progressive and continuous mechanical compaction with burial that is, we assume there has been no diagenetic changes in porosity due to stylolitization, dissolution, or cementation. Given this assumption, and the accumulation history we calculated in Step 2, we can model thickness changes through time using empirical or theoretical porosity/depth curves.
First, we determine a relationship between porosity and thickness by assuming that the solid mass of a unit, or the mass of grains plus matrix, is constant during burial. The solid mass of a unit at depth z is equal to

 (1)
(1)
where TZ and ϕZ are the thickness and porosity of the unit at depth Z. Assuming constant solid mass during burial, we can equate the solid mass of a particular unit at two different depths, Z1 and Z2, using Equation 1 :
 (2)
(2)
By rearranging terms, we can calculate the thickness of a unit at depth Z2, if we know its porosity at depth Z2, and its thickness and porosity at another depth, Z1:
 (3)
(3)
If depth Z1 equals the present depth of the unit, we can measure or estimate its thickness,  , and porosity,
  . To calculate the thickness of a unit when it was at another depth, we need a relationship between porosity and paleoburial depth. Commonly, we estimate this relationship by plotting observed values of porosity versus depth for specific lithologies, and then fitting a generalized curve to these data. This approach assumes that the generalized curve is applicable to past conditions. Sclater and Christie (1980) fit exponential curves to lithology-dependent, porosity/depth data using the following expression:
 (4)
(4)
where
ϕ = the porosity at burial depth Z,
ϕO = the initial porosity (i.e., at Z = 0), and c = a constant
The curves and data values are given in Table 2 and Figure 5 (Lithology-dependent exponential porosity-depth curves.).
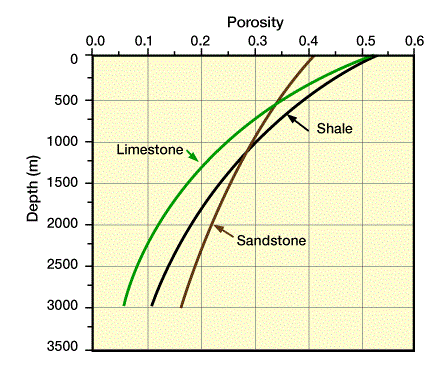
We can use these generalized curves, or we can fit a curve to our own porosity/depth data. For this example, we used Equation 4 with the constants listed in Table 2.
| Lithology | φo unitless | c (m−1) | ρg (gm/cm3) |
|---|---|---|---|
| Sandstone | 0.40 | 3.0⋅10−4 | 2.65 |
| Shale | 0.50 | 5.0⋅10−4 | 2.72 |
| Limestone | 0.50 | 7.0⋅10−4 | 2.71 |
For convenience, we display calculated values in a diagram showing the progression of porosities and thicknesses as we remove successive units and decompact the column. Table 3 shows a sample calculation corresponding to the following steps. Calculated changes in elevation of the base of the stratigraphic column are shown in Figure 4.
Unit = 4
Time = 77.3 Ma
Step 1:
New Depth=Depth to Unit 4 at 71.4 Ma (Thickness of youngest unit)
=1141m−472m
=669m
Step 2:
Midpoint=New Depth−1/2 Thickness of Unit 4 at 71.4 Ma
=669m−1/2 ⋅ 160m
=589m

=0,33
Step 3:


Depth to Base =Depth to Top+Thickness
Depth to Base =584m+179m=763m
Table 3: Example decompaction calculation for Unit 4 Formation at 77.3 Mya. Steps correspond to the list of steps for decompaction given in the text.
We take the following steps to progressively decompact units:
Step 3a: Starting with the complete measured stratigraphic column, remove the youngest unit, shift the column up so that the top of the next youngest unit is at depth zero, and calculate new unit depths (Figure 6, Shifted Column, Example decompaction of units).
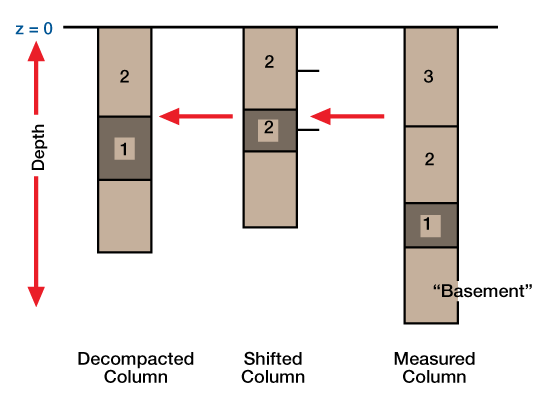
Unit 3 was removed, and all other units were shifted such that the new column top is at a zero depth [z=0]. The heavy tic marks on the right side of this “shifted column” mark the midpoints of the remaining units. These midpoints can be used in calculating the average porosity of the unit, as discussed in the text. We obtain the “decompacted column” by correcting thicknesses of remaining units for the compaction effect caused by the deposition os Unit 3.). This step is equivalent to calculating the accumulation history, but we calculate elevations for each unit.
Step 3b: Calculate unit porosities at the new shifted depths using Equation 4. A simple approach is to assume that the average porosity of the unit is equal to the porosity at the midpoint of the unit; this approach is more valid for thin units than for thick ones. Using values for φ and c from Table 2, and letting Z equal the midpoint depth of each unit, calculate a new porosity for each unit.
Step 3c: Using the porosities calculated in Step 2, and present unit thicknesses and porosities (i.e., the column at 68.4 Mya), use Equation 3 to calculate new unit thicknesses. To reduce progressive errors in applying Equation 3, let Z1 equal the original depth for each calculation, rather than the depth of the unit from the previously calculated column. Arrange units using these calculated thicknesses to obtain a decompacted column (Figure 6). Plot the new positions of units on the geohistory or backstrip diagrams (Figure 4).
We repeat these three steps by removing successively younger units until we have removed all units.
Step 4: Correct for paleowater depth variations and construct a geohistory diagram:
We use geohistory diagrams to show as accurately as possible the changes in elevations of stratigraphic units and surfaces. The accumulation history and decompacted curves we have calculated to this point show elevation changes of stratigraphic units and surfaces relative to the sea floor or land surface at each time interval (i.e., the top of the stratigraphic column; Figure 4 Because tectonic movement, sedimentation, erosion and eustasy cause elevation changes of the land surface and sea floor relative to a fixed absolute elevation, we must apply corrections to translate the calculated columns into an absolute reference frame.
To do this, we begin with a relative reference frame. We use paleobathymetric estimates from fossils, lithofacies, stratigraphic sequences, clinoform topography, or depositional systems to translate column elevations to a reference frame relative to sea level at each time interval. To translate the columns, we add the water depth at the time of deposition of the top of the youngest unit to the stratigraphic unit depths. This correction shifts columns down an amount equal to the paleowater depth.
Geohistory diagrams show actual elevation changes of stratigraphic units and surfaces, and are commonly constructed by applying corrections only for sediment compaction and paleowater depth variations. To construct diagrams with an absolute reference frame, we must apply corrections for eustatic variations. Figure 7 shows a typical geohistory diagram for the Cretaceous units.
Step 5: Correct for lithospheric compensation of surface loads and construct a backstrip diagram:
On time scales of millions of years, total subsidence within basins is caused by lithospheric responses to tectonic and surface loads. The tectonic subsidence equals the total subsidence minus vertical movements caused by surface loads. To identify the response due to each type of load, we might ask “What would the subsidence of the basin have been had no surface loads been applied?” To answer this question, we build a compensation model, and, knowing total sediment and water loads, calculate the vertical movements due solely to surface loading.
To remove the effect of surface loads, we must first determine their magnitudes. To do this, we measure or estimate stratigraphic unit thickness and bulk density, paleowater depth variations, and, if we use a flexural compensation model, the regional distribution of stratigraphic units and shoreline positions through time.
The compensation model we choose depends on the degree to which surface loads were compensated isostatically or flexurally, and the available data and computer resources. If loads were compensated flexurally, there is a trade-off between the accuracy in determining responses to loads and the increased computing resources necessary for applying a flexural compensation model. Flexural models can introduce errors, if we have insufficient geological data to constrain the model. Often, incomplete or uncertain data may prevent us from using flexural models, and we apply Airy models instead. In the current example, we use an Airy compensation model.
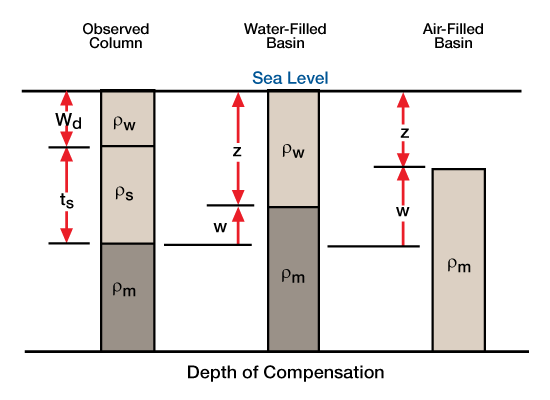
One approach to calculating tectonic subsidence is to ask, “How much would the basin have subsided if no sediment had been deposited, and the basin had been filled with water only?” To answer this question, we remove sediment loads, calculate the uplift caused by this reduced loading, and replace the remaining space below sea level with water (Figure 8; “Water-Filled Basin”). The uplift, w, caused by the removal of sediment with thickness ts, and bulk density rs, is equal to
 (5)
(5)
where
ρw= the density of water, and
ρm= the density of the mantle
The depth to “basement” (i.e., the surface at the base of the removed stratigraphic column), Z, is
 (6)
(6)
where Wd is the water depth. Substituting Equation 5 into Equation 6 gives an expression for calculating the depth to basement if the basin had been water-filled:
 (7)
(7)
Values for depth to basement assuming a water-filled basin for the Cretaceous units are given in Table 1 and are plotted as a backstrip diagram Figure 9, Backstrip diagrams for the Cretaceous units of Figure 3.
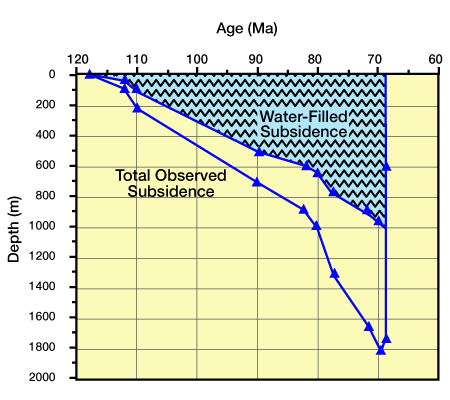
For both graphs, “Total Observed Subsidence” is equivalent to the “Water-Depth Corrected” curve in Figure 4 . The “Water-Filled Subsidence” in the Figure 9 was determined by calculating the isostatic adjustment of the total observed subsidence curve to removal of sediment loads.) and Figure 10,
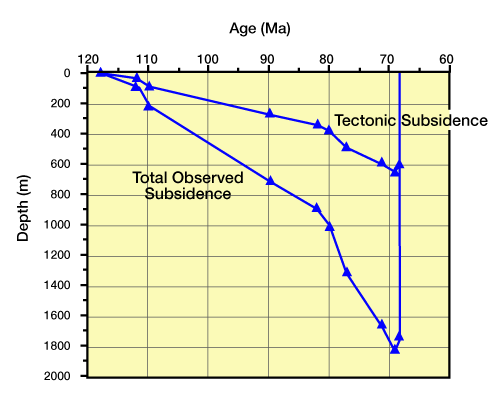
The “Tectonic Subsidence” curve in Figure 10 was determined by calculating the isostatic adjustment of the total observed subsidence curve to removal of sediment and water loads.). For these values, ρm equals 3.3 gm/cm3, ρw equals 1.0 gm/cm3, Wd equals the minimum water depth estimate for each column (Figure 3), and ts equals the decompacted thickness of each column (Table 1). We calculate values for ρs, or column bulk density, for each column using decompaction corrected unit porosities, and grain and water densities:
![\rho _{s}=\sum ^{n}_{i=1}\left[ \left( 1-\phi _{1}\right) \rho _{g}+\phi _{1}\rho _{W}\right]](https://petroshine.com/wp-content/ql-cache/quicklatex.com-a20037af0be4cb237e312e6e5d16e2e5_l3.png "Rendered by QuickLaTeX.com") (8)
(8)
where
n= the number of units in a column
ϕi= each unit porosity, and
ρg= the grain density
Typical values for lithology-specific grain densities used in this example are listed in Table 2.
Another approach is to ask, “How much would the basin have subsided if no sediment had been deposited, and the basin were drained of water?” To answer this question, we remove sediment and water loads, calculate the uplift caused by this reduced loading, and replace the remaining space with air (Figure 8; “Air-Filled Basin”). The uplift, w, caused by removal of sediment with thickness ts and bulk density ρs, using water depth Wd and density ρw is equal to:
 (9)
(9)
where ρm is the density of the mantle.
Substituting Equation 9 into Equation 6 gives the following expression for depth to basement, Z, assuming no sediment or water loads:
 (10)
(10)
Values for depth to basement assuming an air-filled basin for the Cretaceous units are given in Table 1 , and plotted as a backstrip diagram (Figure 9 and Figure 10). The parameter values used in calculating depths of an air-filled basin are the same as those we used in calculating depths of a water-filled basin.
We can divide the total observed subsidence of a basin into three components: 1) subsidence caused by tectonic stresses; 2) subsidence caused by sediment loads; and 3) subsidence caused by water loads (Figure 11).
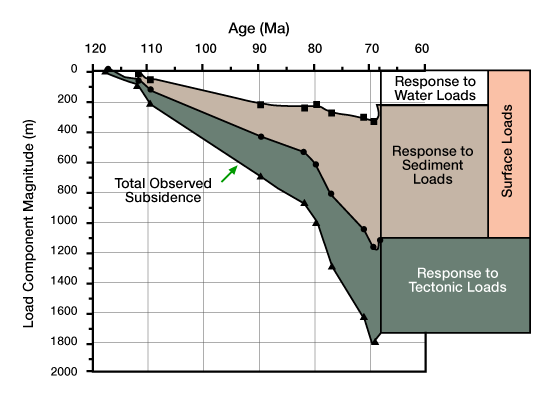
FIGURE 11
Tectonic subsidence equals the total observed subsidence minus the subsidence caused by all surficial loads (Equation 9; Figure 10). We also use tectonic subsidence to represent the total observed subsidence minus the subsidence caused only by sediment loads (Equation 7; Figure 9).
Which backstrip calculation we use depends on the purpose of our study: do we need actual values to identify tectonic responses, or are we comparing the backstripping results to other curves? For example, if we want to compare the backstrip calculation with the output of a geodynamic model that calculates subsidence curves of a water-filled basin, then we calculate the backstrip assuming a water-filled basin. Similarly, if we want to compare the backstrip calculation with other backstrip diagrams, then we calculate the backstrip using the same assumptions and procedures used in those studies. But, if we need actual values for the response of a basin to tectonic stresses only, then we should calculate subsidence for an air-filled basin.
In the Cretaceous example above, after we apply corrections for paleowater depth, the elevations of stratigraphic units and surfaces shown in the geohistory and backstrip diagrams are in a relative reference frame. That is, the zero depth of each diagram is set to the elevation of the water/air interface for marine sediments or the elevation of the sediment/air interface for non-marine sediments. To determine paleo-elevations in an absolute reference frame, we must add eustatic variations to water depths at each time interval. Geohistory and backstrip diagrams that have not been corrected for eustatic variations contain perturbations in shape due to these variations. To increase the accuracy of representing paleo-elevations of stratigraphic units or amounts and timing of tectonic subsidence, we must correct for eustatic variations.