Related Articles


Relative Permeability
Hydrocarbon reservoirs contain water, gas and/or oil in variable quantities. Each phase interferes with, and impedes the flow of, the others. Relative permeability is a dimensionless term that has great importance when two of the fluids, such as oil and water, move through the pore spaces.
Specific, or absolute, permeability is the permeability of a porous medium to one fluid at 100% saturation. For example, in the aquifer the reservoir contains water as a single phase at 100% water saturation. Effective permeability is the permeability to a given phase when more than one phase saturates the porous medium. The effective permeability, then, is a function of the fluid saturation. Relative permeability to a given phase is defined as the ratio of the effective permeability to the absolute, or in some cases, the base permeability. Relative permeability, then, is also a function of the saturation and can be expressed as a number between 0 and 1, or as a percentage. The pore type and the rock wettability affect the relative permeability.
In core analysis data that were generated prior to 1973, the specific permeability to air was often used as the base permeability. Since that time, the common base has been the hydrocarbon permeability in the presence of irreducible water. For an oil-water reservoir, this would mean the base permeability would be the effective permeability to oil at irreducible water saturation. For a gas reservoir, the base permeability would be the permeability to gas in the presence of irreducible water. Figure 1 illustrates gas-water relative permeability data when water displaces gas.
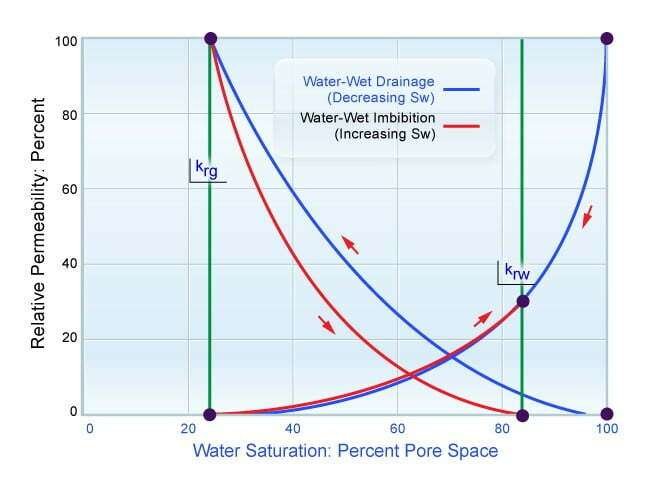
Imbibition and Drainage Processes
The terms imbibition and drainage are also employed when discussing relative permeability tests. Their meanings imply what is happening in the pore space to the wetting phase as the relative permeability tests are measured. If the wetting phase is decreasing, that phase is draining and the curve is called a drainage curve. If the wetting phase is increasing or being imbibed during the test, the curve is referred to as an imbibition curve (Figure 2).

For a water-wet reservoir, the drainage curves apply during the time that water is draining from the reservoir and hydrocarbons are accumulating. Once the reservoir rock or laboratory sample has attained an equilibrium water saturation value and the water is subsequently increased by natural water influx or the introduction of coring or test fluids, the imbibition curves apply. In oil-wet rock, a reduction in the oil phase by water flooding would be referred to as a drainage curve. These data are required in many reservoir engineering calculations, and the laboratory tests that develop them should follow the same saturation history as that in the reservoir.
Laboratory Methods for Measuring Relative Permeability
Two major laboratory methods have evolved to measure relative permeability (Figure 3). These are referred to as the steady-state and nonsteady-state techniques.

Steady-state: The steady-state test, the older of the two methods, is made at low flow rates, and the test apparatus contains upstream and downstream mixer heads to remove capillary end effects. Many organizations prefer data obtained from the steady-state test. Two fluids are injected simultaneously into a core sample and the water saturation is increased slowly. This simulates the slow increase in water saturation that would occur in the formation between the water injection and hydrocarbon producing wells. Saturation increase is monitored by measuring the gain in weight occurring in the sample, or by X-ray technique.
Nonsteady-state: The nonsteady-state technique uses a viscous oil and is normally made at a higher flow rate than that present in the reservoir. It is this higher rate that sometimes yields pessimistic estimates of hydrocarbon recovery from rocks of intermediate wettability.
Heaviside and Black (1983) analyzed the two techniques and presented recommendations on the most appropriate way to measure water-oil relative permeability depending upon the wetting characteristics of the rock.
Wettability Effects
The natural preference of a porous medium, which causes one fluid to adhere to its surfaces rather than another, is referred to as its wettability. A water-wet porous medium causes water to adhere to its surfaces. The wettability of a rock has a dramatic influence on the relative permeability curves. It is, therefore, essential that the core samples tested in the laboratory reflect the actual formation wettability, and that the initial water saturation in the test sample be of the same magnitude and have the same spatial location as it has in the reservoir. This requirement has led to the acquisition of “native state” cores. These are cores taken with crude oil or with other oil-base fluids that do not alter the wettability or water saturation present in the recovered core.
Figure 4 illustrates the effects of core wettability on water-oil relative permeability measurements (Owens and Archer, 1971).

These data indicate that as the rock becomes more oil-wet, the relative permeability to oil decreases and the relative permeability to water increases at any given saturation. This results in unfavorable recovery efficiency. It also indicates that the residual oil saturation in intermediate to oil-wet rocks is a function of the volume of water that flows through the core sample, and that the relative permeability to water existing at floodout will be much higher for the oil-wet formation. An interesting observation is that the reduction of capillary retentive forces in the oil-wet rock allows a lower residual oil saturation to be achieved in the oil-wet rock if the project’s economics would support continued water injection.
Wettability may be estimated from the shapes of relative permeability curves. However, it should be remembered that a similar shift in the relative permeability curves can also be caused by changes in other rock properties (Morgan and Gordon, 1970).
Critical Water Saturation
Critical water saturation (sometimes called the irreducible water saturation) is the point where the water saturation is sufficiently low that there is no measurable water cut. Water, although present, is held in place by capillary forces and will not flow. If the actual water saturation is higher than this critical saturation level, then both water and hydrocarbon flow during production. As the water saturation further increases, there will come a point at high water saturation at which only water flows. The critical water saturation varies depending mainly on the rock type, composition, porosity and permeability (Hartmann et al., 2014). Critical water saturations are usually determined through special core analysis.
