Related Articles


Electrical Properties
Electrical measurements made on core samples in the laboratory define, for any given formation, the parameters that are used in the LWD and wireline log calculations of water saturation. The measured properties include the resistivity of the core at 100% water saturation ( ), at native state (
 ), and the resistivity of the formation water (
 ). The relationship between rock properties and water saturation is as follows:
1. 
2. 
or
3. 
Where:
 = formation brine saturation, fraction
= formation brine resistivity, ohmmeters
= true formation resistivity, ohmmeters
= true resistivity of 100% brine-saturated rock, ohmmeters
 = formation resistivity factor
 = measured porosity, fraction
 = intercept on versus plot
 = saturation exponent, slope of
  versus plot
 = cementation exponent (slope of versus plot)
* The resistivity index ( ) is defined as the true formation resistivity () at any saturation divided by the resistivity at 100% saturation ().
By using these equations we can refine log calculations and no longer need to rely on estimates presented in the literature.
Formation Factor versus Porosity
The formation factor () has been defined Archie, (1942) as the resistivity of a 100% water saturated rock () divided by the resistivity of the saturating formation water (). When the measured formation factor is plotted against the measured porosity, the slope of the resulting line establishes the cementation exponent (). This is illustrated in Figure 1 along with limits observed in laboratory tests. Dernaika et al. (2013) observed that the cementation exponent () was systematically reported to be lower in the measured whole core samples than in the 1.5 inch core plugs.
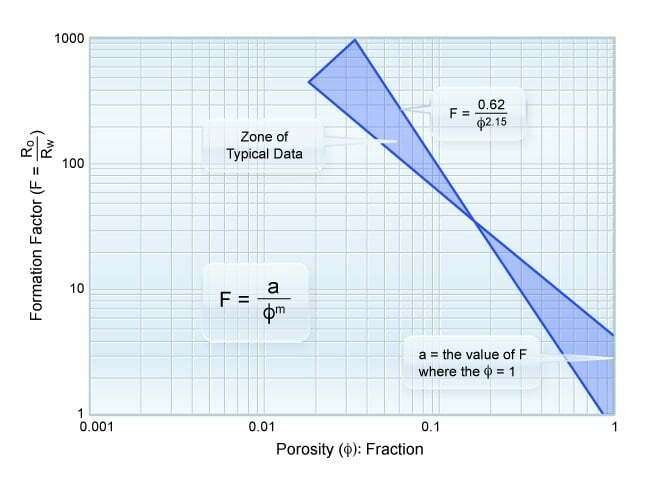
Most carbonate reservoirs are characterized by multiple-porosity systems that impart petrophysical heterogeneity to the gross reservoir interval.
Resistivity Index versus Water Saturation
As the water saturation decreases in a given sample, the true formation resistivity rises. This occurs because less water, and subsequently fewer ions, are available to conduct electricity. As mentioned previously the resistivity index () is defined as the true formation resistivity () at any saturation divided by the resistivity at 100% saturation (). Figure 2 shows a typical plot of the resistivity index versus water saturation over a range of laboratory-measured data.
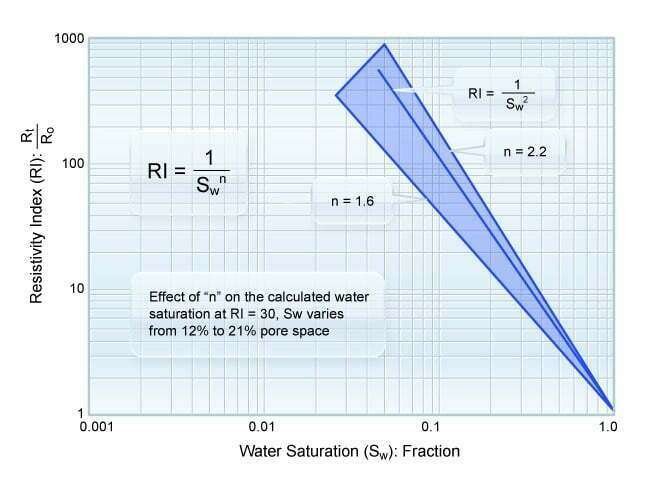
The saturation exponent () is the slope of the resistivity index versus water saturation line.
In very rare cases, both the and values exceed the limits illustrated in Figure 1 and Figure 2. For example, if the rock matrix contains conductive matrix components, the n value can fall outside the illustrated limits. The calculation of water saturation is very sensitive to m as the porosity decreases, and use of an incorrect m value can generate water saturation errors of up to 50% pore space.
In their study of multi-scale SCAL measurements in a giant carbonate oil field, Dernaika et al. (2013) found that whole core resistivity index () measurements were on the lower end of values from the core plug measurements, especially when large variations were recorded from the plug data.
Clay Effects
The presence of clay often suppresses the rock resistivity, and generates lower m and variable n values. The water saturation equation that was developed to accommodate the presence of clays that conduct electricity becomes more complex than that given in Equation 3. Water saturation equations that incorporate the measured cation exchange capacity effects caused by clays are the Waxman-Smits and Waxman-Thomas equations (1968, 1974):
4. ![S_w=\left [\dfrac{F^*\cdot R_w}{R_t\left (1+ \dfrac{R_w\cdot B\cdot Q_v}{S_w} \right )} \right ]^{\tfrac{1}{n^*}}](https://petroshine.com/wp-content/ql-cache/quicklatex.com-b3f3caf837d7202e5803bce61b6d4b40_l3.png "Rendered by QuickLaTeX.com")
where:
5. 
6. 
Where the following apply:
 = formation resistivity factor independent of clay conductivity =
 = saturation exponent independent of clay conductivity
 = specific cation conductance,
 = quantity of cation exchangeable clay present,
  of pore space
 = cation exchange capacity,
 = grain density of rock matrix,
= equation coefficient associated with 
= cementation exponent (slope of vs plot)
Neglecting the cation exchange capacity (using Equation 4 rather than 5) results in pessimistic estimates of the hydrocarbons in place (Koerperich 1975; Keelan and McGinley 1979). The cation exchange capacity can only be reliably determined on rock samples from the specific formation being evaluated.
The Waxman-Smits and Waxman-Thomas equations require a trial and error solution, as the water saturation ( ) appears on both sides of Equation 4. Keelan and McGinley (1979) have shown how the measured laboratory values of m and n may be modified to establish the and values required for the Waxman-Smits and Waxman-Thomas equations. Table 1 displays the differences in the calculated water saturation that may occur when using and values for clean sand versus values developed for use in the Waxman-Smits and Waxman-Thomas equations. Note the pessimistic estimate of hydrocarbons in place that will result if the clean sandstone is used rather than the equations for shaly sandstone.
| Table 1: Comparative values of calculated water saturation, using clean sand and shaly sand equations, for a shaly formation (Keelan and McGurley, 1979. Reprinted with permission of SPWLA.) | ||||
|---|---|---|---|---|
| Waxman-Smits-Thomas | Laboratory Data | Clean Sand | ||
| (1) Laboratory data correctly adjusted to *values (equation 2) (2) Laboratory values used as reported (3) Clean sand values assumed correct and ignoring clay and shale effects (equation 4) | ||||
| (1) | (2) | (3) | ||
| No. | Porosity | |||
| 1 | 20.4 | 47 | 55 | 66 |
| 2 | 17.8 | 56 | 68 | 87 |
| 3 | 16.3 | 57 | 72 | 95 |
| 4 | 20.1 | 54 | 64 | 79 |
| 5 | 14.3 | 61 | 80 | 111 |
| 6 | 25.2 | 59 | 59 | 69 |
| 7 | 25.4 | 55 | 51 | 58 |
| 8 | 27.3 | 57 | 51 | 57 |
| 9 | 17.5 | 74 | 73 | 95 |
| 10 | 20.0 | 60 | 70 | 88 |
| 11 | 17.4 | 68 | 75 | 99 |
| 12 | 14.4 | 74 | 86 | 119 |
